Here’s the share price reaction as I type to Barclays being fined £290 million by the US and UK authorities for trying to improperly influence the LIBOR market:

The shares are down 11% so far today.
Barclays is not alone in being investigated by the regulators – it’s just the first to be fined. More fines for other banks seem likely to follow, as well as lawsuits.
The FSA findings that led to Barclays’ fine make grimly comic reading:
For example, on 26 October 2006, an external trader made a request for a lower three month US dollar LIBOR submission. The external trader stated in an email to Trader G at Barclays “If it comes in unchanged I’m a dead man”.
Trader G responded that he would “have a chat”.
Barclays’ submission on that day for three month US dollar LIBOR was half a basis point lower than the day before, rather than being unchanged.
The external trader thanked Trader G for Barclays’ LIBOR submission later that day: “Dude. I owe you big time! Come over one day after work and I’m opening a bottle of Bollinger”.
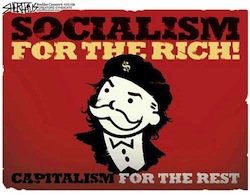
This sort of thing shouldn’t come as a surprise to long-term Monevator readers. I was highlighting the unfair profits and prominence afforded to bankers from the earliest days of the financial crisis.
But it’s easy to forget how hallowed their reputation was in the pre-crisis days.
Most free market advocates (of which I am one) assumed that if banks were making super-sized profits, it must be because of super-sized intellects, operations, social utility, and so forth – as opposed to super-sized leverage that ultimately blew-up the US housing market, and super-sized bets that paid off at bonus time for an individual prop trader, but where the risks were carried by bank shareholders, and ultimately by taxpayers.
The scales having fallen from most people’s eyes since those days, though each fresh revelation seems to come as a surprise to some investors – and to other bankers, who typically say their firm is one of the good guys, ironically often shortly before uncovering skeletons in their own closet.
The deification and subsequent grilling of JP Morgan’s Jamie Dimon springs to mind. His time as a financial saint came to an end when a $2 billion hedge at his bank blew up, leading some to conclude it wasn’t really a hedge, but just another speculative bet gone wrong.
I happen to rate Dimon, and I don’t think all bankers should be tarred with the same moral brush – these specific LIBOR allegations being waged against Barclays and certain other banks seem to me to be in a whole other class of bad to the usual charge of banker greed and recklessness.
Nevertheless, being the best captain – or a hard-working deckhand – in a fleet of rotten ships doesn’t stop the fleet from taking on water and sinking.
I have long maintained:
- Most bankers (and many other financial sector workers) are grossly overpaid, due to them effectively gaming the system – generally not through personal wrongdoing, but due to the systematic changes in banking over the past 30 years.
- What is grossly overpaid? I’m not saying a top Oxbridge graduate working at a bank shouldn’t earn say £85,000 a year in his 30s, given the complexity of what they do and the demand for their services. The point is salaries have run far (far!) in excess of that.
- Much (not all) of financial sector activity is a zero-sum game, with winners and losers netted off against each other, and taxpayers the patsy at the table.
- The lucrative attractions of work in the City has attracted our brightest minds. That’s a terrible waste, given its aforementioned zero-sum nature. Maybe we’d have cured cancer, solved nuclear fusion or cheap desalination or be colonising the moon without this brain drain.
- Brighter people than me have (since the crash) pointed out that much financial activity is socially useless.
- Sure, we live in a free market economy. But we set the rules! We restrain untrammeled union power, apply windfall taxes to natural resource extraction, and break up monopolies, amongst much else. We can and should tackle any undesirable side-effects of the free market system.
- Most speculative activities – including investment banking – would be far less risky for the system as a whole if it was confined to old-style partnerships (or hedge funds, for that matter), and probably better for our economy, too, even if it increased the cost of capital.
Bankers’ bonuses: First up against the wall?
Some readers may be nodding along at this point. But from experience, I know I’ve also lost the nods of many of you.
A good proportion of you work in the City, my web server records tell me, as indeed do some of my friends for that matter.
So be it. I think increasing income inequality is at the heart of today’s worrying loss of faith in capitalism – even if the typical dinner party agitator claims to be motivated by the lot of NHS workers or rural Indians, as opposed to their own pay check.
And income inequality is a dangerous topic even among supporters of capitalism.
Long before I began blogging, I used to point out how in my opinion bankers were grossly over-valued and overpaid.
Sadly, only card-carrying socialists agreed with me. My friends on the right – and other investors I spoke to – said the market was extremely efficient, and I simply didn’t understand the good that bankers were doing.
But I kept up the case on Monevator. For example, in March 2008, I wrote:
I’m also angry that capitalism, which I believe is the best system we’ve got for growing prosperity, must seemingly go hand-in-hand with being held hostage to a termite-like financial sector that ceaselessly looks to make a fast buck before adding value, and that remains so loftily disdainful of any suggestion that it might be required to take its own medicine.
Then the second leg of the financial crisis hit, Lehman’s collapsed, and old-style investment banking was wiped away at a stroke.
At last the game was up for bankers!
But it wasn’t. After three months penance – which pretty much amounted to cancelling the Christmas 2008 parties and losing some dead wood – bankers were back, raking in their bonuses, or beginning to shift how they received their ‘compensation’ (the amusing US term for salary, suggesting some token gifts given to saintly bankers for forcing them to grubby their hands with a job).
Bonuses guaranteed
As late as December 2009 I still hadn’t grasped I was flogging a dead horse, writing:
I don’t say [bankers] shouldn’t earn well for doing a vital job, or that they don’t work very hard.
I say so do many other people, and they earn barely 10% as much as elite bankers. The money that goes to bankers is out of proportion, and a clear reflection of market distortion, as plenty of people cleverer than me have written about in depth.
Bankers have seemingly no ability to conceive of the bigger picture, or the fact that the financial system was bailed out by the State for reasons other than their own good. They think they’re a class apart.
As Fed chairman Ben Bernanke has said, intervention to save key players in the system was done despite the fact that doing so stank.
Yet even when we pull back from the brink, bankers can’t take one year off the gravy train before they start to award themselves huge sums again!
Bankers didn’t get it then, and they don’t get it now.
We’re told there were a few rotten eggs at Barclays. These new revelations – bankers will say – don’t reveal anything intrinsically rotten at the heart of the financial system. It’s of no consequence that at the height of the crisis, when people were worried that the cash machines would stop working, these jokers were still trying to influence LIBOR for their own ends.
As the BBC reports:
Between 2007 and 2009, during the height of the banking crisis, the staff put in artificially low figures, to avoid the suspicion that Barclays was under financial stress and thus having to borrow at noticeably higher rates than its competitors.
How poignant now to remember the early commentary from the financial crisis, when old financial hacks would sigh wistfully and talk about the Governor of the Bank of England raising an eyebrow to keep the bankers in line.
Perhaps 40 years ago.
The truth is while the Governor’s eyebrows were hitting the roof, some bankers were allegedly attempting to rig one of the key benchmarks of the entire global financial system.
Every day a pay day
By 2010 huge swathes of the media were railing against the financial sector. Even the FT and The Economist were pointing out that the Emporer had no clothes, with the latter noting that something had to give on pay:
The industry’s continuing prioritisation of staff over shareholders suggests that banks are still being managed badly.
During the boom, banks’ shareholders showed all the resistance of a doormat on pay. But now they have lots of capital tied up in a mature, even declining, industry that cannot control its costs properly, it is time for them to take command.
Yet it wasn’t just the bankers and their investors who shrugged. The general business community didn’t seem to get it either. It repeatedly rallied around these latter-day pharaohs, a bit like slaves supporting plans for yet another, even taller and more socially useless pyramid of stone.
Given the latest figures on income inequality, especially in the US, it’s becoming clearer why. A self-interested slice at the top of the income and wealth league fears any restraint to financial sector pay, surely because it raises questions about their own escalating gains, too.
That’s fair enough – that’s capitalism. But the frightening thing is how the rest of us seem to have lost our ability to stop them.
Divide and conquer
For my part, my negative experience of thankless banker bashing on Monevator was compounded by the fact that only ‘the mob’ seemed to realise we’d been had.
Bankers invariably jumped to the defense of other bankers. And so did many others from the financial sector.
There is probably something in the nature of being a super-high earner in the City that makes you immune to much critical introspection. Yet even other industrial leaders told politicians to lay off bankers.
I didn’t want to side with the mob. Seeing the audience on Question Time blame everything from expensive NHS drugs to brutal policing in the Arab Spring on bankers had me almost feeling sorry for the boys from RBS and Barclays.
So eventually I stopped bothering about bankers, and I never got around to writing much more about income inequality.
But in the light of these latest revelations, I can’t help saying I told you so.
While we’re at it, I warned that bankers wouldn’t voluntarily reign in their salaries in response to the crisis, too.
Sure enough, to quote just one statistic (from April 2012):
Barclays shares fell 25 percent last year, yet its total [staff] compensation ratio rose from 43 percent to 47 percent. Diamond’s 2010 bonus was £6.5m.
Perhaps it’s not their fault. Maybe we’d all be like it if we worked day and night on the floor of an investment bank and were paid £150,000 a year plus a bonus – the self-justification instinct in human beings is strong.
Whatever the cause, bankers really do consider themselves a breed apart. But that doesn’t mean we have to share their opinion.
Please, can we finally rein them in?