
Like an Empty Nester cocooned in equity in a four-bed detached house overlooking the Green Belt who frets about what his daughter will do to afford a £200,000 bedsit in Brixton, I’ve got a split mind when it comes to UK residential property.
- UK houses still feel expensive, not least by the traditional measure of the house price to earnings ratio.
- On the other hand, I agree there’s a shortage of houses in the UK – or at least of property for sale of the type people want to buy (within reason), where they want to buy it, at prices they can pay.
I was therefore able to post in late November 2011 that given the various attempts to prop up the ailing property market (especially the latest NewBuy mortgage indemnity scheme) shares in house builders looked a better bet than the houses themselves.
As a group, the UK’s seven largest listed house builders are up more than 30% since I posted. Not bad for middle-class dinner party chat turned into an investment thesis!
But I’m not gloating. While shares in house builders have done well in double-fast time, my investment has barely dented the opportunity cost of missing out on six-figure gains from London property over the past decade.
More importantly, there’s a flaw in my two-handed view of the market as glaring as a three-story extension without planning permission in the Antarctic.
The contradiction: Prices are set by supply and demand, so if there’s a shortage of houses and strong demand, then houses can’t be too expensive. Can they?
A quick recap on higher house prices
Most people – even most homeowners – seem to think UK house prices are pretty high, even after the falls of recent years.
But a commonplace view isn’t necessarily correct – and a knee-jerk ‘sticker shock’ reaction to a very large number is a dangerous way to judge value. Before you know it, you’re an 80-year old grannie who complains about the menu at Pizza Express, on the grounds that a meal with a decent bottle of wine used to cost 50p, plus a quick snog at the end of the night.
To illustrate my point, check out this graph of house prices since the 1960s, courtesy of Nationwide (via Finance Blog):

The 1960s: Flares were big but house prices were not
More clued-up grannies are well aware that inflation means 50p isn’t what it used to be (although I’m sure a snog remains welcome). The prices of many things rise a great deal over time – sometimes far faster than inflation.
We saw when we looked at historical house prices that price growth isn’t quite so shocking when viewed in inflation-adjusted money (i.e. in ‘real’ terms).
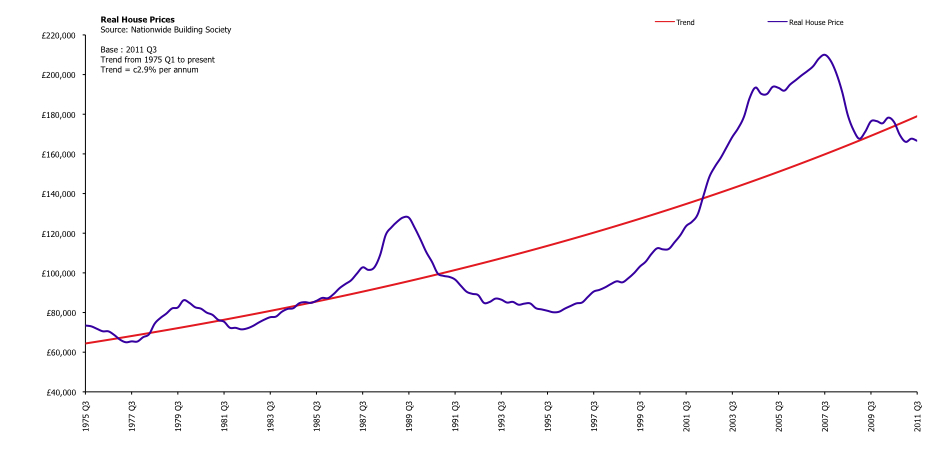
Indeed, real house price growth has recently fallen a little behind trend:

(Click to enlarge this graph of UK house prices in real terms)
Real house prices have been growing at about 2.9% per year since the mid-1970s. In other words, houses have been getting more expensive relative to the average basket of goods for most of the past four decades.
Now, the official RPI basket includes a nearly 24% weighting towards housing costs, so there’s some element of circularity to this.
It’s probably more useful therefore to look at the cost of houses relative to earnings, since that’s where most of us find the money to pay for one.
House price to earnings ratio
Comparing house prices to earnings was what scared me out of buying in London around 2003/2004. And on the historical measure of the house price to earnings ratio, UK property still looks superficially expensive.
Here’s a recent-ish graph of house prices to earnings from The Telegraph:

Don't look down!
The house price to earnings ratio approached 6.5 before the property slump – a level unthinkable just a few years before. You can see that even though it then declined sharply towards its long run average, by 2011 the ratio was still above the level at which the last property boom peaked in 1989.
The price to earnings measure in the graph is also higher than when I first got cold feet about buying a house, partly due to graphs like this one. That decision cost me at least six figures as prices continued to rise regardless, so be warned about putting too much store in this ratio.
Since 2008 the house price to earnings ratio has been coming down, partly as wages have increased a little despite the recession, but mainly because prices have been falling.
But can we really say the ratio ‘should’ fall below some average level, as per the graph above, before we can call houses fair value?
I don’t think so, for the simple reason that this ratio has been rising for years. I plotted my own graph setting the latest house price data from Halifax against the UK National mean full-time wage for men (same source) and added a trend line as follows:

House price to earnings ratio for UK houses (Click to enlarge)
The black line shows that over the past 20 years, the house price to earnings ratio has been creeping higher. In fact, houses now look slightly good value on this single measure.
Of course, you can quibble.
Firstly, the bigger the boom – or bubble, if you prefer – the more the trend line is potentially distorted.
Also, it clearly matters where you start and end your graph. I’ve used the two decades of data Halifax makes available, but the trend line would look very different over say 1990 to 1995, or from 2007 to 2011.
I seem to remember that when I started closely watching this statistic around the turn of the century, 3.5 was said to be the ‘natural’ level of house prices versus earnings. Looking at the graph above, it now seems this view came about largely a result of the depressed prices of the mid-1990s.
Another criticism might be to ask why the ratio should be based on male full-time earnings, when so many women have entered the workforce over this period.
I think that’s true – but it’s also another reason why the ratio may have moved permanently higher. More women bidding for houses against (or in partnership with) men will clearly increase the ratio for single male salaries, too.
All this – and other weaknesses, such as the fact that the ratio is based on gross income, not mortgage affordability, for example – means I now think the ratio should be taken as just one of several factors in judging whether house prices look too high.
If somebody had tried to bet on the long-term trajectory of food prices based on the average household’s grocery bill in the 1950s versus wages, they’d have ended up bankrupt.
If food spending can decline over five decades as a percentage of our spending, then might we not spend more on housing? Or cars? Or smartphones?
I’m not saying spending more money on houses is desirable either individually or for society. I’m just pointing out that we have been on a long march from subsidence living to buying the latest iPad.
Perhaps housing has become a luxury item for many, in that they’re prepared to spend more of their discretionary income to get the best they can?
But… salaries do influence mortgage sizes
There’s one important caveat to all this.
Before the lending was relaxed over the past couple of decades, mortgages used to be rationed out by banks on a much stricter basis of salary.
One repeatedly hears that 3x your salary was the limit, though I can’t remember ever seeing concrete figures.
If banks do go back to old-fashioned lending as a result of the credit crisis, as some suggest, then perhaps this lending ratio will come down again to reflect tighter access to mortgages, rather than the demand for housing.
Indeed, in London the price to earnings ratio remains more elevated – by my calculations it’s turned higher again, in fact – partly because so many properties are bought with a far higher proportion of cash, or no mortgage at all.
That in turn means the technical constraint implied by bank lending is less relevant in London. Mortgages don’t matter so much. 1
Household income and inflation
I’ll probably get hate mail from property bears for suggesting the price to earnings ratio isn’t written in stone.
Before my email server blows up, I should stress that while I now believe the ratio of house prices to average earnings is a bit of a moveable feast, I agree there’s a commonsense relationship between how much people earn, and how much they can then spend on their largest single asset in most cases, their home.
Whatever multiple banks happen to apply, salaries remain the key criteria they use to decide how big a mortgage to grant, which in turn (partly) determines how much money is chasing property at any given time.
Mortgages aren’t everything, especially in the current depressed market – a record 40% of homes were bought with cash in early 2011, more than double the rate of five years before, for example.
But in most of the UK, cash-rich buyers are in the definite minority and mortgage finance drives the market.
Even in a world without mortgages where we saved up to buy a home, salaries would still ultimately dictate house prices (alongside inheritances and winnings from spreadbetting, presumably).
And the fact is salaries have not gone up at the same pace as house prices.
This lagging is captured in the elevated house price to earnings ratio. But a closer look at inflation-adjusted earnings is also revealing.
Using data from Measuring Worth, I created the following graph of nominal and real wage growth in the UK between 1982 and 2010, which neatly covers the same period as the house price to earnings graph above:

A graph of real earnings in the UK (Click to enlarge).
Over the period from 1982 to 2010:
- The increase in nominal earnings in the UK from around £5,600 per year to £23,500 is an impressive 320%.
- But in inflation-adjusted terms, the rise in earnings is much more modest – just 52%.
Eye-balling the graph of real house prices above suggests real prices rose by around 200% from 1982 to their peak in 2008. Far faster than earnings!
This couldn’t continue forever – and it didn’t.
Earnings aren’t everything
So what have we discovered? Nothing definitive, which is why house prices remain an enduring subject of conversation at a certain kind of dinner party, just ahead of “no, those aren’t my car keys…”
It’s clear growth in real earnings has massively lagged real house prices, and that’s partly captured in an increasing house price to earnings ratio.
If you accept the rising trend over three decades to spend more of our incomes on property, then the ratio no longer looks so stretched, especially outside of London. This might indicate house prices are closer to fair value.
However by itself, the house price to earnings ratio doesn’t seem to be a solid indicator as to whether house prices are cheap or not, or whether they will rise or fall.
In particular, the simple ratio overlooks a vital component of mortgage affordability – the very likely reason why prices didn’t fall as much as they might have in the downturn.
That key missing variable is of course interest rates, which determine how much of your earnings will actually be gobbled up paying off your mortgage.
As anyone who has read this far will know, interest rates have plunged over the past 30 years, which you’d think must be a big factor in driving house prices.
I’ll therefore look at house prices and interest rates in my next post in this series.
(Subscribe to make sure you get it!)
- The London property market is really a beast in itself. I may do a separate post on the other factors that drive it, which range from foreign buyers and bank bonuses to true scarcity and, recently, the Olympics[↩]


Comments on this entry are closed.
When we bought our first house in 1987, it was 3x one salary with other salary not counting, but some lenders would do 2.5x joint salary.
Over the next decade or two, I saw figures as high as 5x salary mentioned, but they now tend to use more complex “affordability” criteria.
http://www.fool.co.uk/mortgages/mortgage-calculator/borrow-calculator.aspx
In 1987, we borrowed 2.2x my income, and even that was a struggle at times!
@ gadgetmind, we bought our house the year earlier (1986) and we could borrow 2.5 times the highest salary + the second salary. The house was within budget but we lost it to gazumping (does this even happen now??). We ended up spending 20% more on a far better property & in reality saved us a move (and associated costs) later down the line. We then needed a mortgage which was more than the multiple would allow. I made an appointment to (beg) see the building society manager, he asked me if I thought I could afford it, I said yes and got the mortgage. I wonder if local branch managers have that kind of discretion now? As in your case it was a struggle for quite a few years but was the best decision we ever made, were still in the same house. (thank you gazumpers!!)
As far as I can remember, when I bought my first house in 1981 I was restricted to 3x salary – higher than the normal 2.5x due to me expecting an increasing salary (I was a computer programmer). I vividly recall almost losing the house because I’d accepted the kind offer from the seller’s estate agent who could arrange 100% mortgages. After a few weeks of silence, they sheepishly got back to me to let me know their tied building society had changed their plans and I’d have to start looking for a mortgage myself.
Thirty years later, with sons who will probably want to buy a house at some point, the whole housing market looks quite scary. There seems to be a lot of retirees who will still have mortgages, a lot of people with interest-only mortgages and no idea how to pay off the principal, and now everyone seems alarmed by interest rates rising from 3% to 4.5% – which suggests there’s no slack to cope with rates returning to historical norms. I’m thinking 7%, but maybe that’s just one of those “it was hard in my day” fuzzy memories.
@ steve, i’ve still got my ‘notice of change in mortgage interest rate’ (to show the kids!!) dated aug84 which shows it going from 10.5% to 13.125%, by aug85 it was 14.25%!!! What would that do to todays market?
@harry. Ah yes. I’d forgotten the fun we’d had. Luckily my assumed salary increases had actually happened. Only having £22,000 worth of mortgage helps a bit, too!
@steve, suppose its because we’d taken on a mortgage back then of £22k that I now couldn’t face the idea of taking on one of £220k. I wouldn’t/couldn’t pay what my house is now worth even @ these low interest rates.
@ Harry
Regards “I wouldn’t/couldn’t pay what my house is now worth”, I could *just* afford to buy our house now, but I wouldn’t buy it as I don’t think it’s worth the asking price we’d put on it.
@gadgetmind, “wouldn’t” for the same reason, “couldn’t” we’ve been in this position for many many years. Think we moved and ‘stretched’ ourselves at exactly the right time. Even 2 or 3 years later and it would have been out of our range.
@harry, @gadgetmind
I’m perhaps a little unusual in that we sold that £22,000 house (for £48,000) in ’91, then moved abroad. When we returned in 1997, we couldn’t afford a house and we rented. From about 2000, our income was sufficient to buy the house we were renting (for £160,000; with 25% deposit), but we were always freaked out by that commitment, and paid it off ASAP.
To us, a £120,000 mortgage always meant “6x what we paid in the past”, and it didn’t feel as if we had 6x as much spare cash if interest rates moved against us.
This arbitrary “price anchoring” might be wrong-headed, but it’s a reality check against doing daft things based on unusually low mortgage interest rates.
I think fundamentally price to earnings is the key measure. On that basis things are better, but they’re a long way from normal and don’t reflect the new economic reality.
I think a few more years of nominal losses (and therefore bigger real losses) will be enough to take the shine of anybody’s ideas about property being an investment.
Once we eventually get back to people thinking that buying a house is risky and that share are better (once a new bull market starts in that asset class!) then things might start to look like the mid 90’s and if you have any flexibility in when or what you’re buying it might make sense to stretch a bit and jump a rung or three on the ladder.
Yes, price anchoring is something to guard against just like the ‘sticker shock’ I mention in the piece. I imagine the majority of those Monevator readers under say 35 will end up living in £1 million pound properties, certainly in the south east. (I am assuming readers of this website will do better than average, financially).
Don’t disagree with the risks of a low interest rate environment, but have to say I think I’d take my chances with a 4% ten year fix!
But more on that in my upcoming interest rates post.
Re supply and demand – there was once a lot of demand for a certain type of bulbs and not a lot of supply. Further, there were a lot of people regretting not buying bulbs. The only problem is that they can remain overvalued forever. Overvalued or undervalued, the market always sets the price. Tulip bulbs could still cost daft amounts if people hadn’t realised just how dumb what they were doing was. I will only value a house on the basis of the income I gain by not paying rent and sticking to traditional valuation metrics.
Nicely done, Monevator! I just added a link to your article in my own US-based discussion of the same thing. (http://www.mrmoneymustache.com/2012/03/09/housing-prices-bargain-of-a-lifetime-or-much-further-to-fall/)
I think it’s valuable for owners and investors in both of our countries to see the stark difference in their property markets, to remind themselves that bubbles really do pop, and housing depressions really do end eventually.
I’ve always said that people with the means to do so should consider moving to beautiful areas with cheap housing, to benefit from these anomalies. I’m actually looking forward to the arrival of one pair of central London refugees who are soon moving to my part of the US for partly this reason.
Post-crash, our flat would still only rent for 1/20th of the market value, per annum. Figure on keeping 50% of that after maintenance, admin, tax etc, and that’s a nominal return of 2.5%…
I wasn’t a savvy monevator reader back then… but it has put me off any idea of keeping this place to rent out if we move!
@MMM — Glad you liked it, and thanks very much for stopping by and even more so for the link! I will look to reciprocate in a future installment of this series in the spirit of International Brotherhood And Money Making that you allude to hear. I certainly learned a bit from watching the US market, chiefly that as ever “It can never happen here!” turned out to mean “It’s about to happen here!” That said, I do somewhat salivate at US property prices in some US states now — not so much as an investor as in my guise as a potential nester who would like to buy without the massive net worth risk that buying in the UK, in London at least, still seems to entail.
@Rob — I am with you in spirit. The trouble is the same thing could — and regularly was — said as far back as 2004 here in London. I’ve shown about how one ‘traditional’ value measure looked to have peaked, and then promptly went about 50% higher (from around 4.5 to near 7). I am still sitting out the market, but I do so far more humbly now, and I’ve hedged a bit with investments in the likes of housebuilders and Lloyds.
@Dave — I genuinely have no idea how my landlord makes any money off this place, once wear-and-tear is taken into account. In fact, I presume he doesn’t. Then again his mortgage is being paid off (he was an Owner Occupier originally, so he’s on a repayment). Drip drip drip. I’d be around 15 years into paying off a mortgage if I’d bought some bedsit in London when I got my first job (and even I thought London property was a screaming buy — I just didn’t like bedsits, and was cash poor, with no access to a Bank of Mum and Dad. 🙁 ).
I like the price to income ratio, but I think that needs to be after-tax income.
@George — An interesting idea, but also one that points to the difficulties of putting too much store by it. For instance, we are well into the post-mortgage interest tax relief era here in the UK. (Something like two decades in, from memory!) So those buying properties on the old 3x earnings in the 1980s were also getting tax relief on some of their payments. Then again, interest rates were close to 10% for much of that time. Around and around we go.
For this reason, I think it may pay to keep rules of thumb like the P/E of houses simple, but equally to not treat them as gospel.
@TI – don’t get too swayed by the low prices of some houses in the US as many of them are made out of cardboard and fluff rather than bricks and mortar.
Parts of my house are older then their whole country, and I’ve got a WW2 underground air-raid shelter tucked underneath in case things ever turn nasty again!
Leave them to their gnawing termites and playful tornadoes, an Englishman needs his castle!
@TheInvestor – depends if you are doing it on average incomes or income per house… I’d favour the latter. Whatever the income is of the person likely to buy that house, now or in the future, that should be the value multiple. Beyond that the rule should work within a range because there is only so much of your lifetime income that you can put into a home if you want a pension, food, sustenance and a bit of spending money.
I loved that opening turn of phrase 🙂
The trend line of your second graph (this graph of UK house prices in real terms) is bent. I smell a rat!
I think the biggest variable that changed was the entry of women to the workforce over the 30-odd years of your graphs. This meant that suddenly twice the amount of income was available for buying houses, as Rob indicates above.
I was quoted three times one salary or 2.5 x both salaries together in 1989, since I only had one salary it was a struggle. Single first-time buyers have been the biggest losers of that change.
I think the biggest variable that changed was the entry of women to the workforce over the 30-odd years of your graphs. This meant that suddenly twice the amount of income was available for buying houses, as Rob indicates above.
Yes, I agree that was probably part of it, and if nobody else suggested it I’d have to. 🙂
On the other hand, it was allied with other social trends that might have added or reduced the demand for different tranches of housing (more household formation, later partner-based cohabitation, longer time in education, massive reduction in social housing stock via right to buy, and the — I think often underestimated — huge influx of amateur landlord money via BTL chasing the same market as first time buyers from the mid-90s onwards… this series of posts could run and run! 😉 I think I best do a grab bag roundup at the end).
Very kind, re: my cocooning.
@ermine:
No rat….that trend line is bent because it is an exponetial function (2.9%/a). If the graph had been plotted on a log-linear scale it would have shown a straight trend line.
Fantastic post!
This was really interesting too, making the point that stats comparing cost of buying vs renting often ignores the impact of deposits. http://www.cml.org.uk/cml/media/press/3168
Cheers Lemondy! 🙂 Once again you supply an important insight, which I’ll definitely add to my forthcoming exploration of prices vs rents (will come sometime after prices and interest rates). Hope you’re well.
It may not be clear whether earnings and house prices are fair. However, the fact that the average age of a first time buyer in London is now 32 perhaps is an indicator of how much the property market has changed over the years. Quite often young professionals find that they can actually live in better locations and properties if they rent. Therefore, when they eventually take the plunge house prices can appear overpriced in conjunction with their earnings. This article summarises for me that this is an issue which cannot really be resolved.
I sold some gilts and went full-throttle on equities (well, 90% allocation) in August ’11, so with the FTSE at 6K, I’m doing *just fine*, thanks for asking! I hope you are also well and enjoying the ride. Housebuilders were a good bet last year.
I am intriguied by your point here about women in the workforce. I wonder if household earnings (post-tax?) significantly diverged from earnings per head, I have not seen stats on that, perhaps the ONS have it. But then I suppose some dual-income families will take on extra childcare costs to offset loss of the Stay-At-Home Parent. Very interesting topic.
Fascinating charts, thanks.
There’s no doubt twin incomes has raised the bar in terms of affordability. Having said that, prices are clearly being propped up by low interest rates and the banks attempting to avoid repossession wherever possible. The crunch will come when interest rates go up.
My best guess is both nominal and real prices will fall for the next 2-3 years before rising again as the economy improves. A population increase of approx 5 million over the next decade or so should also push prices higher.
The double income effect is the missing link
Not only are (some) women high earners in the work force but high earners (i.e. university graduates) are now much more likely to end up marrying other high earners because so many more women go to university
The end is result is high income inequality, which we are undoubtedly seeing in the UK because the Gini coefficient has gone up in the last 30 years
This would logically lead you expect that the most desirable houses’ price (i.e. the ones closest to the most high paying jobs) would explode…
…et volia house prices in London and the SE have exploded…
…the mystery to me is that prices in places in the UK where the prospects of high paid employment are so much worse ALSO exploded in the 2000s
(That said I think cheap plentiful credit in the past had as significant an effect)
My prediction would be savage falls in areas of the UK dependant on public sector employment and much lower price falls in nominal terms in London and the SE
(My favourite interesting statistic of the day: 50% of new build flats in Prime Central London are bought by Asian buyers)
Long term house prices are directly related to the loan amount the average person can get from a mortgage provider, the actuary models all hover around ‘3’ in terms of repayment risk. Unless banks can find fools they can sell weaker loans onto (By getting A ratings for Poo etc.) it will return to a similiar ratio, the only reason house prices haven’t nose-dived is because interst rates are at the lowest since 1600 something, banks are being leniant when homeowners can’t make payments, there is a first time buyer incentive, a fund of up to 5k per person if you can’t make your payment etc. etc. etc. HOUSE PRICES GO BYE BYE
Interesting post, very informative and full of great facts. The crises imposing on UK and all of Europe is directly affecting the employees in the public sector and even though the average domestic income is greater than in the past, this economy may cause a decrease in salary and therefore a decrease in the purchasing power of the population. I expect house prices will go down in future.
This current situation has made many of the young adults in UK consider house share or flatshare, in their early years of independence, since that is a way to decease the monthly living costs. The result of this is a dramatic increase in online search for roommates, houses to share, flats to share all over UK.
What a well written piece on property, and a very interesting blog too. Warning: this is rather a lengthy post, attempting to take the baton on from your post, with a focus on London property.
I have data on real house price growth for the UK since c.1950 and in London since c.1970. Even looking at trend since 1950, you are right that for the UK as a whole we are more or less back to trend. The only small bit of caution is we tend to undercut trend as much as we overshoot – there is a strong symmetry in the chart over time. So since we were a few standard deviations above trend in the last move higher, history would suggest we end a similar amount below trend before turning higher in real terms. (Note how great this chart is for long term market timing.)
The London real house price trend is a different story. We are still above trend and have a big correction in store if we are revert to the 40 year trend line. I’m sure the disconnect between London and the UK would also show itself for the ratio of house prices to earnings. On nearly all metrics, UK property as a whole looks OK, whilst London looks dangerous.
In all bubbles, there needs to be a widespread view of a shortage. We all know the statistics. We are not building enough property in the UK, and especially in London, and London’s population is growing sharply. London prices, as a result, are in bubble territory. Kensington & Chelsea are now regularly achieving £2000-2500 per sq foot, and sometimes higher. We are getting to parity with Monaco prices, ie the most expensive on earth. Whilst we Brits have no tax advantages, foreigners see London as a top tax haven. Many countries now charge annual levies on the value of properties, and since we don’t, London has become the favourite destination to park cash, wherever it came from, and with no questions asked. This is a major explanation for the foreign buying driven moon-shot in prime London. It’s certainly not the weather.
What can crack the prime London market? Clearly there is no value left, and so it is now a momentum market. It is going up simply because it is going up. Interestingly, whilst it is being chased higher, transaction volumes are falling sharply – a classic market tell. I think if we had two or three quarters of falling prices it could turn south sharply. I think the major catalyst for a turn is probably political, vs economic. Income disparity for the top 1% of earners vs the rest of the country is now getting so extreme, both the Lib Dems and Labour are likely to implement a Mansion Tax. It is a simple vote winner, and is probably merited in the interests of social cohesion. The Tories would never introduce it, but the general election is now only 2.5 years away. A Lab-Lib coalition may well not occur, but if it did, expect a Mansion Tax as part of the manifesto for both parties. A 1% annual levy on all property above £2m would lead to an avalanche of foreign selling in London. The stamp duty impact has been modest because it is a one-off levy. Annual levies are different. Francois Hollande’s recent change to the annual levy In France is causing high-end prices to fall meaningfully. FYI here is the French annual levy:
< 800 000 € 0 %
between 800.000 € and 1.310.000 € 0.55 %
between 1.310.000 € and 2.570.000 € 0.75 %
between 2.570.000 € and 4.040.000 € 1 %
between 4.040.000 € and 7.710.000 € 1.30 %
between 7.710.000 € and 16.790.000 € 1.65 %
over 16.790.000 € 1.80 %
It works out being a similar to what we are likely to do here, if more complicated with all the tiering.
Very shoddy terraced houses in Kensington with no garden are now selling for £3m-£5m. Good family houses with a decent garden are now only available north of £6m. It is a mania, and history will see it as such, but we may need to wait a couple more years for the turn. If only there was a way to short prime London. The legendary economist Robert Shiller has launched a series of property derivatives in the US, I hope he does it here too.
The risk to the rest of London is the tent-pole effect. Mayfair / Kensington & Chelsea hold up the rest of the market. If Kensington is X, then Fulham is X/2, Clapham X/3. This means that when Prime does crack I do think most of London will fall with it.
Where does this leave the outlook? In the end, for the long term investor, property is now hamstrung by record low interest rates. The super normal returns in property since the early 1980's were fuelled by interest rates falling from c.16% in 1981/82 to effectively zero today. Given leverage is so critical to property valuation, the absence of any further possible improvement in financing costs seriously hampers the upside from here. The sad irony is that most home buyers still believe that 1980-2008 era returns are still possible. Property investment is hardwired into the national psyche now, after 30 stellar years. But fundamentally, prices should only rise in line with nominal income growth over the long term from here.
So it looks like there is less downside in the UK ex London, but it is hard to get excited about the upside. London property looks extremely dangerous, but we need a trigger to break the momentum.
Equities look a lot better, it should not be a surprise that they have been outperforming handsomely since the turn in 2009. Whilst this is not advice, I would buy decent quality equities for investment and limit your property exposure to what gives your family a good quality of life.
I think the thing that none of us ever imagine is the impossible, like a factory build, a new office complex outside the balcony, a change in the landscape, massive technology changes. All it takes is one bad legislator and suddenly those green fields and nice views from our homes are offices, factories, and compulsory purchase orders.
It seems a little narrow to be just looking at UK wages and economic data, if that’s what we’re doing.
Especially since the late 90s, the market in all assets has become far more global, including UK property especially London. Growth in incomes in other areas like Asia, ASEAN, some parts of the middle East, US (in the late 90s/early 2000s) has far outstripped that of the UK yet some of that money has made it into London.
I don’t know how big a distortion that puts on the numbers, but I know in a number of parts of London there are lots of foreign buyers, and in some parts they represent the majority (where prices have risen the most).
Combine that with investors generally looking at a decent return on their money. One poster commented that 2.5% is pretty poor as a return on an investment – but put that in perspective these days for a relatively stable asset class, and it looks pretty decent, especially in the context of a monthly payout. In many parts of London, a 6-7% yield is still quite easy to come by. Try getting that out of your bank account or a stable mutual fund.
So for me the big takeaway is that the macro-economic fundamentals – money supply expansion, low return on most asset classes, the need to invest in fixed assets for ‘safe keeping’ of money, growth in BRICS, and the general globalisation of most economies and investment classes, combined with ease of moving money, with the development of the internet – mean it doesn’t make much sense to compare to what things were in the 80s and 90s and say “we’re overvalued because we’re not there any more.”
If you think it’s bad in London, take a look at Hong Kong and what the money printing is doing there…
@nac — Indeed, the distortion (if that’s the right word — not sure I’d agree) for property prices in London from foreign money is immense. I am long overdue a post on this, but then again the effect does seem to be moderating slightly as the Eurozone crisis eases, and the government has moved to tax purchases through companies etc.
@nac — Indeed, the distortion (if that’s the right word — not sure I’d agree) for property prices in London from foreign money is immense. I am long overdue a post on this, but then again the effect does seem to be moderating slightly as the Eurozone crisis eases, and the government has moved to tax purchases through companies etc.
Everybody talks about interest rates and how once interest rates go up, the market will crash.
However, there is a missing factor in the equation… politicians will NOT let rates go higher. In the same way the stock market has been propped up since the 2008 crash, so interest rates will be kept artificially low. There are too many politicians with vested interests sitting on huge property portfolios themselves.
You can’t go back to the early 70/80s and draw a trend line and call that the long term. Go back to 1880 and draw your trend lines if you want to see the reality.
@david — I take your general point. But when it comes to house prices I’m not sure that going back to a period before women could vote, when nearly all of them stayed at home, when nearly everyone was married and single person households were the overwhelming minority, when Sterling was linked to the gold standard and all credit and capital flows in and out of the country was rationed, and when Britain had an Empire tells us much more to be honest.
@The Investor – “Don’t disagree with the risks of a low interest rate environment, but have to say I think I’d take my chances with a 4% ten year fix!”
Time for you to put your money where your mouth is!
http://www.guardian.co.uk/money/2013/apr/26/yorkshire-10-year-fixed-mortgage
A 3.99% mortgage fix for 10 years, with a 25% deposit.
@Brendan — Indeed, I’ve been slobbering over the idea of one of these mortgages for some time. See: http://monevator.com/cheap-re-mortgage-to-invest/
That one does look particularly attractive, given how low the added fees are. Thanks for sharing.
Someone mentioned that the house prices to income ratio should really be after tax. I would also be curios to see how it is affected when comparing different percentile incomes, as inequality has also greatly increased in the last 20 years. Perhaps answering the question of how house buying has changed for the average Joe.
The big part of the problem that few people seem inclined to talk about is that the U.K. currently allows unlimited immigration from EU countries. This guarantees a large number of new arrivals from mostly poorer countries and one way or another, some way will have to be found to house them.
A possible solution to this could be to limit new inward migration to the number of UK citizens emigrating to the EU.
Part 4?
If I wasn’t allowed to recruit seriously bright people from elsewhere in the EU then I’d be stuffed as we don’t have enough home grown engineers.
One possible solution to our housing shortage could be to encourage outward migration of our own no hopers, but who’d take them?
I have 4 friends who studied engineering….. All but one of them managed to find a job in engineering. The one that did find a job, is currently working in Beijing, one I got a job at my Accounting firm and the others work jobs for an hour rate. We have a lot of home grown engineers, just not enough jobs for them @gadgetmind.
I’m glad most of your engineering friends managed to find a job in engineering, but not at all surprised. Good engineers are in demand, and the the last six I have hired break down to two from Spain, two from Greece, one from Australian and one in Beijing.
I’ve now got 10+ open hires and am going to have to scour the globe despite sign-off at £30k+ for fresh graduates and 2x-3x times that for 5-10 years experience.
Anyone who claims we don’t have enough jobs for engineers doesn’t know an engineer really is. Even some “engineers”
fall into this category.
Thanks for sharing Mr Monevator! 🙂
Well written and sourced article, like Andrew G posted above I second the notion to produce a graph of house prices to income ratio after tax.
I read recently that net immigration from 1997-2010 totalled nearly 4 million whilst only 2.61 million homes were constructed in the same period. How does this house supply deficit factor into the figures?
A 30,000 ft view of global house prices, over time from the past to the future, with another demand/supply phase transition beginning to play out:
https://open.substack.com/pub/unchartedterritories/p/why-i-dont-invest-in-real-estate