After a gruelling year in which bonds got pasted, it’s time to take a hard look at the other defensive assets that can comprise a truly diversified portfolio. Bonds alone are not enough.
We Brits imported the idea that government bonds can shoulder the burden of defensive duties alone from the US. But their perspective is misleading, because their bonds have performed much better than ours:
As an aside, as a proud citizen of Blighty I can’t help but notice how the thick-wooded mass of positive US equity returns in the first graph contrasts with the stunted scrub-land of their UK counterparts in the second. It’s a reminder of why we need to be globally diversified.
The really unflattering comparison though is with our government bonds.
Bungling bonds
The UK experience is that our gilts relatively rarely put in a positive performance when equities are down.
In fact, the rise of gilts when equities tumble is mostly a 21st Century phenomenon.
Gilts are more temperamental than their US cousins. They’ve meted out bear market losses five times and breached -30% losses twice.
To top it off, their long-term growth contribution is a measly 0.91% annualised return.
UK government bonds have been less effective than US Treasuries in large part because we’re more vulnerable to inflation over here.
Why a diversified portfolio needs a multi-layered defence
Bonds hate accelerating inflation. So we need to layer in additional diversifying investments, which aren’t as susceptible to the inflationary money bandit.
This chart shows how several key diversifying asset classes perform when we narrow the focus to years when equities posted a negative annual return.
Exciting technical note: In this chart I’ve used the performance of UK Treasury Bills as a proxy for cash. Ordinary investors can hope to do better with ‘best buy’ savings accounts. Gold returns are priced in pounds.
UK equities ended the year down 42 times out of 123 from 1900-2022. That’s 34% of all occasions. Ideally we’re looking for defensive assets that pop their heads over the 0% parapet whenever the going gets rough with shares.
We can see cash offers some limited resistance at times. Gold wins a medal for defying the big, bad bears of the 1970s and the Global Financial Crisis.
But not a single asset class relieves the pain with convincing regularity – not across the entire timeframe.
There are also wasted years when nothing works.
This muddy picture suggests we need a bit of everything.
How often defensive assets support a diversified portfolio
The bar chart shows how often each asset class succeeded in diversifying against equity losses. By which I mean they weren’t as bad as equities that year. It doesn’t mean they always clocked up a positive return.
Gilts softened the hard equity rain in just under 70% of all stock market down years. Gold rode to the rescue almost 80% of the time. Meanwhile cash deployed its emergency parachute on 86% of occasions.
On the other hand, each diversifier sometimes made matters worse:
Gilts 31% of the time
Gold 21% of the time
Cash 14% of the time
Remember we’re talking inflation-adjusted returns here, which explains why cash can be a loser even when shares are down.
Nobody’s perfect
I don’t think the fallibility of portfolio diversifiers is widely understood. Many investors expect their portfolio countermeasures to work perfectly every time. They don’t.
In fact, all three diversifiers failed simultaneously 10% of the time. That means equities were actually the least-worst asset class to own during those particular down years.
Oh, you were hoping your defensive assets would actually produce a positive return during a crisis were you?
Tsk! Some people.
Okay, just for you let’s see how often the diversifiers landed sunny-side up.
Frequency that diversifying asset classes produce positive returns
Hmm, not great.
Gilts coughed up a positive result barely 29% of the time. Gold scrapes over the 40% line and cash manages a 42% hit rate.
And all three turned negative simultaneously in 36% of years that equities fell.
Psychologically that’s going to grind down anyone if they don’t realise it’s perfectly normal!
Portfolio diversification isn’t broken. This happens sometimes. More often than we’d like to think.
What is the best diversifying asset class when equities fall?
Which asset class generates the strongest performance during a down year?
Cash dominates the field, then gold. Gilts head up the defence only 17% of the time.
Again, that blue wedge shows that the diversifiers fell further than equities four years out of 42.
(Note: The pie doesn’t sum to 100% due to rounding errors and The Investor’s allergy to decimal points.)
But not all stock market slumps are equally terrifying. How do the diversifiers offset the risks of equities during the biggest disasters faced by UK investors?
Defensive diversifiers vs the UK’s eight worst bear markets
Our historical record contains some dark days. The all-time low occurred when the stock market collapsed -72% in 1972-74.
Meanwhile, World War One and the Spanish Flu combined to smash stocks -57% from 1913 to 1920.
World War Two was the awful sandwich between two bears. The first letting rip in the late 1930s, with the second only subsiding by 1952.
Here’s how often each asset class blunted the UK stock market’s eight biggest blows:
Asset
Outperformed equities
Positive return
Best diversifier
Failed
Gilts
6
3
1
2
Gold
8
4
4
0
Cash
7
4
3
1
By this measure gold and cash still look like the UK’s leading emergency first responders.
Gold beats equities in all eight nightmare scenarios. It delivers a positive return four times, and was the best diversifier four times. Cash notches similar numbers.
That’s especially worth noting if you’re a retiree whose sustainable withdrawal rate depends on your portfolio surviving an investing tsunami of a similar magnitude.
If you combine the three defensives into a single diversified portfolio then:
All assets outperformed equities six times out of eight.
All assets were in negative territory on three occasions.
At least one asset managed a positive return five times.
There wasn’t a single calamity when all three assets failed to improve portfolio returns.
Horses (of the Apocalypse) for courses
World War One and its aftermath was terrible across the board. Cash was the top-performing asset on this occasion. But it was still down a cumulative 45% by New Year’s Eve 1920.
The Great Depression wasn’t as big a shock to the UK system as it was to America’s. Our equities were down -29%. But gilts and cash both rose by over 20%, with gold not far behind.
Also note that:
The diversifiers all have a pretty good record against deflation. Especially gilts.
Everything fell into the red during World War Two and stayed there.
Gilts really benefit from negative correlations with equities from the Dotcom Bust on… until 2022.
The connection here is interest rates. Gilts are likely to perform in a crisis when interest rates are cut rapidly to deal with falling demand. But gilts are typically a loser when interest rates rapidly rise – especially when inflation rears its ugly head. (Hello 2022!)
Gold also has a solid track record during 21st Century slumps. Partly thanks to the role of the dollar as a safe haven.
King dollar to the rescue
Sterling generally weakens like a balding Samson during ‘risk-off’ events. Which means that UK investors who own USD-priced assets – including gold – will often experience a welcome ‘bounce’ in that corner of their portfolios when the dollar appreciates.
If you’re intrigued but not convinced enough to hold unhedged US Treasuries in your diversified portfolio, then gold is another way to benefit from that currency shift during a market storm.
Would you like to play a game of Risk?
Inflation, pandemics, and war are the major threats that are hard to adequately defend against.
The years when all three diversifiers turn simultaneously negative occur around World War One, World War Two, the Suez Crisis, and the Covid/Ukraine polycrisis.
Government bonds were useless in four out of five of those onslaughts. But you wouldn’t have wanted to be without them in the Great Depression, the Dotcom Bust, or the Global Financial Crisis.
A realistic reading of history admits the scale of those events is not predictable.
Remember that a number of smoking crises had already been snuffed out before Europe combusted into World War One. Even then the major players thought the war would be short.
The Great Depression was preceded by the euphoria of the Roaring Twenties.
Hitler could have been stopped earlier.
The world was unprepared for Covid. And Putin’s Ukraine atrocity, too.
I could go on.
The point is we don’t know what will happen. So why not lean into diversification and spread your bets across every useful defensive asset class?
Isn’t there anything better to diversify risk?
Property REITs, private equity, infrastructure, dividend stocks, and other equity sub-asset classes are all highly-correlated when there’s a global FUBAR.
The short answer to that conundrum is that index-linkers can provide good protection against prolonged, unexpected inflation – provided you buy individual index-linked gilts for a reasonable price, and hold them to maturity.
Non-retirees may well be better off relying on equities to simply outpace inflation over time.
Broad commodities are a wild card. They’re occasionally awesome as in 2022 and 1973-74. But more often they’ll drag you down like concrete Ugg boots.
Moreover, commodities’ long-term returns look like chump change. Which brings us to another important point.
Diversifiers must be growth-positive
Why not just ditch government bonds? Here’s one reason: gilts’ long-term growth rate is better than gold or cash.
The 1900 to 2022 scores on the doors are:
Equities: 4.85%
Gilts: 0.91%
Gold: 0.82%
Cash: 0.45%
Gilts are twice as good as cash, as measured by UK Treasury bills. It’ll be a closer run thing with best buy cash accounts. But the point still stands.
The expected returns of government bonds are higher than gold and cash.
Diversifying risks in a down market
Doubtless we can dial up an optimal blend of assets based on historical returns to reassure ourselves we have the best diversified portfolio possible.
But the truth is there’s no point in finessing asset allocation to the last percentile when past is not prologue.
What the UK’s historical asset class returns tell me is we need them all – because we need to be ready for anything.
For portfolio equity allocations of 60% and above, I’d personally take the defensive remainder and split it evenly three ways between government bonds, gold, and cash.
Or four ways if you are keeping the faith with index-linked bonds. (I am.)
This is a rough-and-ready solution but that’s fine because ‘Man plans and God laughs’.
Apologies to all the non-men out there but it’s a good adage.
Take it steady,
The Accumulator
Postscripts
P.S. If I was starting my diversified portfolio from scratch, I’d invest in global government bonds hedged to GBP rather than just gilts. Here’s some ideas for the best bond funds.
P.P.S. You may conclude that you should just invest in US securities and be done with it. But there’s no guarantee that America’s charmed run will continue. Not because its superpower status is imperilled but because US returns have lagged the rest of the world for entire decades in the past. Ultimately, equity results rest upon valuations. If the prices of US securities are bid too high then they will disappoint those who buy based purely on recent performance. Stay global!
P.P.P.S. I examined UK returns going back to 1871, but equities were only down one year in the Victorian Golden Age. Our top-hatted forebears had to cope with a -1.1% thrashing in 1891, triggered by the Baring Crisis. Gilts and cash were both marginally positive that year, with treasury bills just edging it.
P.P.P.P.S. This is getting silly now.
Òscar Jordà, Katharina Knoll, Dmitry Kuvshinov, Moritz Schularick, and Alan M. Taylor. 2019. “The Rate of Return on Everything, 1870–2015.” Quarterly Journal of Economics, 134(3), 1225-1298.[↩]
Real returns subtract inflation from your investment results. In other words, they’re a more accurate portrayal of your capital growth in relation to purchasing power than standard nominal returns.[↩]
A positive correlation of 1 indicates two assets move up or down together in perfect sync. A negative correlation of -1 indicates they move in opposite directions: when one rises, the other falls. We want diversifying assets to be negatively correlated with equities when stock markets slump. Although we don’t want them to nose-dive when equities rise, either, so ironically it’s best that two assets aren’t perfectly negatively correlated. A correlation of 0 shows that two assets are randomly correlated. In other words, their movements have no relation to each other.[↩]
Much younger readers who’ve known nothing but the lifestyle-curbing consequences of Brexit – not least no right to live and work across the continent like their parents enjoyed without a thought – may find this hard to believe.
But Monevator lost a big chunk of readers in the aftermath of the 2016 referendum.
Many Leave voters didn’t like it when I de-cloaked as someone who thought the whole thing was a crock – and threw this little website into the (futile) fight against the hardest Brexit on the table.
You see, at the time the investing media and forums were dominated by 50-something Blimps spouting a bizarre blend of nostalgia for Empire, shipbuilding and coal mines, and a hyper-free market capitalism which they claimed would get us past centuries-ago proven laws of economics.
To say it was incoherent is to flatter their position with a label.
And today only the most shameless Brexiteers try to make any economic case for Brexit.
I commend this Leave voter on this week’s Question Time for at least not blaming perfidious Remainers for the glaring absence of a Brexit dividend:
Still, it takes some cognitive dissonance to say on national TV that Brexit was touted as something that would take 20 years to deliver economic benefits.
I know you can’t be bothered with me running through the laundry list of campaign claims again.
But like the many Leave voters who also say their Referendum win had nothing to do with racism – somehow forgetting a decade of bile from Farage culminating in Nazi-inspired propaganda on the eve of the vote – anyone claiming Johnson and chums warned it’d take a couple of generations to see any financial benefits of us leaving the EU faces the inconvenient fact that 48% of us were also there.
And I for one will never forget what they really said.
Three years of counting the cost
As I will also always note, there was a credible – albeit to my mind quixotic – political argument for Brexit.
If the fullest possible technical sovereignty for the UK was all-important to you (despite any apparent downsides to its absence) then Brexit was a reasonable price to pay for it.
And at another end of the multi-faceted coalition to Leave, racists and xenophobes also had a case.
But if you truly believed Brexit would deliver economic benefits – or if you knew it wouldn’t but you were a leading Brexiteer who decided to dupe the public – then when will you put your hands up?
There is a feeling among the commentariat that the waters have broken on this dam of denial.
I’m not convinced. But three years on from Brexit, and it is striking how even the ever-timid BBC couldn’t find much to ‘balance’ the economic argument on its Newsnight special this week.
The latest for those who’ve lost track of the score:
The UK is the only G7 economic yet to recover its pre-pandemic size – Reuters
The IMF says we’ll fare worse than Russia, which is under international sanctions – Sky
Almost all the 71 post-Brexit trade deals just replicate our EU arrangements – BBC
The Bank of England says we can no longer grow more than 1% without inflation – FT
Brexit has left the UK economy 5.5% smaller – Bloomberg
Brexit supporting areas have fallen even further behind post-Brexit – Bloomberg
UK car manufacturing output is back to 1956 levels – Fleet News
We’re seeing the worst strikes and industrial unrest since the 1970s – Bloomberg
No wonder: Brexit has ‘cracked Britain’s economic foundations’ – CNN
Net retail sales of UK equity funds have been negative every year since the Brexit referendum in 2016, with cumulative outflows reaching £33.6bn – FT
The numbers are in. From an economic perspective Brexit has been a car crash.
Here’s what you could have won
What, if anything, can be done about it?
Well we could rejoin the EU. Personally I believe that’s far more likely to happen in 20 years than the economic reality-defying renaissance envisaged by the Question Time audience member above.
But for now it’s off the table.
At least PM Rishi Sunak seems somewhat pragmatic, even if he has to keep throwing the same rhetorical discombobulation to the loons in his party.
If his government can sort out the (entirely predictable) issues in Northern Ireland, then perhaps it will pave the way for a renegotiated trade settlement with the European Union.
Maybe even something sensible like the softer sort of Brexit that was thrown off the table in the aftermath of our very close run Referendum.
I appreciate it is unlikely. Free movement remains a lightning rod. Even dashed dreams of effortlessly retiring to the Spanish costas have not persuaded enough Leave voters of the benefits of a quid pro quo.
(With immigration from non-EU countries soaring post-Brexit, maybe these Leavers would support reciprocal free movement deals struck with Kabul or Mogadishu instead? They’re not racist, after all. So I’m sure they’d feel at home under the sun there.)
In the meantime sensible politicians like Jeremy Hunt are left scrambling for anything to take the edge off.
Hunt’s recent speech touting the UK as a centre for innovation was all very well.
But people familiar with, for example, the London-based fintech scene he lauded knows it was built with significant input from a wave of talented immigrants working alongside Brits. Some top players such as Revolut were even founded by immigrants.
What’s more, the government has actually been cutting back on support for innovation. See for example its curbing of R&D tax credits for smaller companies.
With the numpty-wing of the Tory party already calling for income tax cuts just months after the Truss fuss, you can understand why Hunt’s March Budget will blather on about ‘Brexit benefits’ in the way a parent calms a stroppy child by making promises about Father Christmas in April.
But there are no benefits and there’s ever less money to offset the damage.
That’s it. That’s the bottom line.
Don’t believe the hype
Brexit was of the same fantastical populist thinking that saw man-child Donald Trump vow to build a giant continent-spanning wall and Hugo Chávez give communism a second go in Venezuela.
But unlike those disasters, we’ll be living with ours for decades to come.
Maybe the optimists are right and the tide is changing. Perhaps Brexit support will dwindle and be contained to the right-wing of the Tory party and other useful idiots, and the rest of us can try to inch back towards a more sensible economic integration with the giant on our shoulder.
But I think it’s more likely that when this recession ends and the dead cat of the UK economy bounces, Brexiteers will seize on it as evidence that their mendacious project is working.
There will definitely be investment in the future in Britain. There will be new and fantastic British companies. Our universities will continue to turn out some of the brightest innovators in the world.
None of that will have anything to do with Brexit – but when some of it inevitably delivers, it will be claimed as a Brexit dividend.
Our GDP will grow a bit, and Leave supporters will hail it as evidence we’re not shrinking.
There will be no understanding of the counterfactual. Or that we’ll be starting hundreds of billions of pounds in the hole.
I asked an AI for its impression of Brexit.
All very gloomy, but I will add that – aside from ripping away the rights and freedoms you were born with – Brexit needn’t curb your life chances on an individual level.
The long-term advocates of Brexit were always the free-est marketeers of the Tory party.
Similarly, by looking after your own finances – and judiciously investing in global markets, perhaps rebalancing into currency gyrations whenever the pound has a funny turn – clever Monevator readers of a capitalist bent can prosper in a post-Brexit regime.
Have a plan B, in case it all goes truly south. (I mean a second passport or similar).
But I personally think that’s less likely to be needed than it was six months ago. (I’d guess less than 5%?)
The Mini Budget threw a bucket of cold water over the majority of politicians and business leaders. Now nearly everyone understands that rhetoric doesn’t pay the interest on our debt, nor nurses’ wages. Hopefully this has innoculated us against the worst populist derangements.
No, it’s a decade or more of falling behind our European peers that’s nailed-on for us now. Perhaps with more drama to come over Scottish independence.
This article on the pros and cons of a Family Investment Company covers some nuanced issues around accounting and tax. It will not be relevant to the finances of 99%+ of readers – though we expect many more of you will find it interesting, and anyway we want the 99% to understand what the 1% are up to. The article is certainly not personal guidance. You should not act on ANYTHING in this post without seeking professional advice. This article is for entertainment purposes only.
Can you avoid dividend tax by investing through a limited company – specifically by investing via what’s sometimes called a Family Investment Company (FIC)?
And with the pending cut in the dividend allowance to £500, is it worth setting one up, pronto?
I’ve been running a Family Investment Company for nearly 20 years. In that time I’ve made many mistakes, and been asked many questions about the structure.
Today I’m going to answer (nearly) all of them.
It’s a long one. Grab a coffee. Maybe pack some sandwiches.
Family Investment Company 101
Here’s a somewhat idealised scenario for a potential Family Investment Company owner:
You’re an additional rate taxpayer and you expect to remain so for the foreseeable.
You have a £1m portfolio of dividend-paying equities held outside any tax shelters. 1
Your £1m portfolio yields 5%.
That’s £50,000 a year of dividend income.
There currently exists a £2,000 dividend allowance (falling to £500 soon). At the additional rate tax band you pay a 39.35% dividend tax rate.
(£50,000 – £2,000 allowance) * 39.35% = £18,888.
Subtracting that tax from your £50,000 of dividends leaves you with £31,112.
Why is this portfolio so exposed to tax?
In this scenario you’ve already used up all the other tax-efficient wheezes.
You already fill you and your spouse’s ISAs every year. You’re both over the Lifetime Allowance (LTA) in your pensions. You’ve paid off the mortgage. You’ve maxed out the kids JISAs. You have £50,000 worth of premium bonds each. You’ve realised VCTs are a rip off…
…you get the idea! You’re out of options for sheltering your investment income.
If you do have any of these other options left, then you can stop reading right now. A Family Investment Company is going to be much more hassle.
However if you are out of alternatives, then you could use a limited company to defer – and perhaps avoid that dividend tax.
But before we dig into how it works, there’s a couple of things you need to be familiar with.
UK corporation tax for limited companies
UK companies pay corporation tax (CT) on their profits (at 19%) and pay dividends to their shareholders after tax.
Corporation tax is rising to 25% in April 2023 (to pay for Brexit). But that doesn’t matter for us from a FIC perspective, because our limited company doesn’t intend to ever pay it.
Companies don’t have to pay corporation tax on dividends that they receive from their shareholding in other companies.
Why? Because the company that made the profits has already paid the corporation tax. The exemption avoids double taxation.
Realised capital gains on those shareholdings, however, are taxable at the corporation tax rate. And this has serious implications that we’ll come to later.
Directors’ loans
Directors can lend money to their company. If there’s no interest charged on the loan – and as long as the company owes the director money 2 – then there are essentially no tax consequences, for either the director or the company.
By simply keeping a spreadsheet of loans and repayments, you can just wire money in and out of your limited company.
That’s all the tools we need to make the Family Investment Company route potentially attractive.
Enter the Family Investment Company
In our stylized example:
We set up the FIC with, say, £1 of share capital and ourselves as sole director.
The company is furnished with banking and brokerage accounts.
We lend the company £1m.
And then transfer that £1m to the company brokerage account.
We buy a magical share that pays out a 5% dividend yield and has absolutely no price volatility. (Let me know if you find one!)
Every year the company receives £50,000 of dividends and uses that cash to repay the directors loan.
The cash flows look like this (with costs ignored for clarity):
(Click to enlarge)
Your company receives £50,000 a year in dividends (tax-free), and uses the full £50,000 to repay the director’s loan. You therefore receive £50,000 per annum from your £1m invested instead of £31,160. Saving yourself £18,888 per year – or £377,760 over 20 years – of tax.
(I ignored the change in dividend allowance, again, for simplicity).
Getting the million back… after tax
At the end of 20 years – with the director’s loan having been paid off with the dividends – you’d obviously like your £1m back, please.
How do you do that?
The company sells its shares (for zero profit, so no corporation tax), and pays out the £1m cash as a dividend. On which, of course, you need to pay 39.35% dividend tax, so approximately £393,500.
Hence you’ve not actually avoided any tax at all! (Nor mitigated tax, which is a better way to think these days).
We didn’t even include the various costs to pay. In fact we seem to have gone to a great deal of trouble to simply enrich our accountant.
And this is the main objection to this structure. Because whatever you may have heard, a Family Investment Company does not necessarily avoid dividend tax at all, but merely defers it.
Is deferral useful? Well… it depends.
My Family Investment Company
Let’s move beyond our stylized example, and get down to the nitty gritty.
But first an important reminder and disclaimer:
Wealth Warning You should not act on ANYTHING in this post without seeking professional advice. This post is for entertainment purposes only.
What’s the point of deferring tax?
Once money is gone it’s gone. Obviously I’d rather avoid the tax altogether, but I’ll take deferral if that’s the only option.
The Family Investment Company structure essentially enables me to choose the timing of the tax incidence of the dividends. And the FIC decides to pay me dividends when I’m paying the 8.75% rate, rather than the 39.35% rate.
I’ve enjoyed a feast-or-famine career – years when I’ve earned a great deal of money, and years when I’ve earned nothing at all. Dividend payments from the FIC can be stuffed into the lean years.
I have no DB pensions (sadly), so I can control the timing of withdrawals from my SIPPs. There will potentially be years in retirement when I can engineer being a lower-rate taxpayer.
Unfortunately, obvious wheezes like moving abroad for a year don’t work – there’s a specific anti-avoidance rule for ‘close companies’ in this situation.
Winding up the FIC at CGT rates may be possible. But I’ve never done it, so can’t attest to the process.
What if taxes go up?
You can certainly make a reasonable argument that deferral is bad – because taxes in the future will be higher than they are now.
My personal experience is taxes only ever go up. The dividend allowance cut itself is a case in point.
Allowances are cut, or withered away by inflation, or ‘tapered’, or ‘withdrawn’.
Reliefs are removed, restricted, or ‘means-tested’.
Lifetime ‘Allowances’ are introduced, where before you didn’t need to be ‘allowed’ at all.
Taxes are ‘simplified’ in a supposedly neutral way, and then the motivation is quietly forgotten and rates ratcheted up a few years later.
The indexation allowance is removed because we no longer have inflation.
And so on. It only ever gets worse.
Given that the only escape from this is economic growth – something both the UK government and the opposition now appear to be ideologically opposed to – there’s every reason to expect taxes to continue to rise. Indefinitely.
In which case you’d be better off paying taxes now rather than later. And not bothering with a FIC.
How is my Family Investment Company structured?
I’m the sole director. My wife is the company secretary. I own about 30% of the shares. My wife 25%, my children the remaining. My wife and I therefore control the company.
One of my kids is an adult, the other is not.
We have ‘Alphabet’ share classes. Different individuals own different mixes of share classes.
There is some flexibility around paying different levels of dividends on different classes. Lower tax-rate shareholders may happen to enjoy larger dividends than other shareholders. This is slightly complex to set up and the consequences of getting it wrong can be severe, but it does provide some flexibility.
For example, family members may be having a career break, or be in full-time education.
We didn’t pay dividends to non-adult children though. In the opinion of my accountant, this is generally treated as parental income for tax purposes.
How does a FIC compare with setting up a trust?
I’ve no idea. I Googled around a bit and I didn’t think there was much in the way of tax benefits to trusts. That seems to be more about control of assets.
I would say that the directors of a company, if the articles are drafted properly, have a great deal of flexibility to do whatever they like with respect to taking risk. That would not necessarily be appropriate in a trust where there are fiduciary duties.
Does the FIC open up inheritance tax (IHT) options then?
Not obviously. Unfortunately shares in the FIC don’t qualify for IHT Business Property Relief.
Also – and inconveniently – gifting shares in the FIC is a disposal for the giver and are therefore subject to capital gains tax (CGT). Especially inconvenient with the CGT allowance also being cut soon.
My accountant is happy with the value of the shares being the proportional NAV of the FIC at the time, for CGT purposes. So you can do this early on, before the company has accrued much value. But giving away more than 50% potentially introduces control issues.
And don’t be thinking you can just fiddle with the rights associated with each share class to make the kids shares ‘worth’ more. The tax man will see straight through this.
There’s nothing to stop you setting up a second Family Investment Company and giving 49% of the shares to your kids on day one. But then you’re doubling your admin and costs.
Our (loosely held) plan is that once the next generation are proper adults, we (or perhaps grandparents) can subscribe for shares, at NAV effectively, and gift them immediately to the (grand) kids. These are a Potentially Exempt Transfer (PET) under the IHT rules
Our intent is to do enough of this to pass majority control to them during our lifetime. We’ll then leave the minority shareholding to the generation after in our wills. (Yes, subject to IHT).
Someone has suggested holding the FIC shares in a trust… but my head hurts already.
I personally would prefer to just live forever.
Which broker do you use?
Most brokers offer a company or corporate account. We use Interactive Brokers (IBKR).
Why do we use IBKR?
Cheap margin loans. As any Private Equity associate will tell you, debt interest is tax deductible for companies. So if you’re going to apply leverage anywhere in your portfolio then the FIC is by far the best place to do it.
There was a good decade when my FIC was borrowing money from IBKR at about 2% (tax deductible), and repaying my directors loan so that I could use it to offset my mortgage (costing about 3%, not tax deductible).
You probably shouldn’t have one of these structures if you still have a mortgage though.
If you think Interactive Brokers is for you, then please DM me on Twitter for an affiliate link.
How much leverage do you use?
Lots! Between 50-100%. (Where 100% means the FIC owns £100 of stocks for every £50 of capital)
When interest rates were very low – and the interest is an allowable expense to offset against capital gains – why would you not run it hot?
How do I manage the leverage?
In theory the size of the margin loan never exceeds cash that I could feasibly access at close to zero notice and lend to the FIC as a director’s loan. We keep an effectively un-drawn offset mortgage against our Principal Primary Residence (PPR) for just this purpose.
In reality this rule has been ‘passively breached’ on one occasion, when I had to draw down the entire mortgage at the peak of the COVID slump. That was, as they say, ‘squeaky bum’ time.
(For quants-only: I also ensure that there are always sufficient available free funds in the brokerage account to cover the max of the parametric and historical two-day 99.9% Expected Shortfall.)
We’re reducing leverage now that interest rates have risen.
Which bank do you use?
Pretty much all banks offer a business account. Turn up with your incorporation documents and ID, and you should be good to go.
I’ve heard from others that banks don’t like FICs. I’m not sure why this would be, or what would cause the problem. It’s not something I’ve experienced.
If you’re only used to personal banking, then you might be annoyed to learn they could expect you to pay for things.
We use a Santander business account and don’t pay any fees, I guess because we don’t do the things you might pay fees for. (Paying in cash would be an example).
This was not an active choice. We used to use Abbey National, and it merged. Possibly our free account was grandfathered in.
What stocks do you own in the FIC?
This is my most favourite question, because anyone familiar with my stock picking skills would think I was the best person in the world to answer this question.
We’re looking for stocks that don’t go up – something I do appear to be an expert on!
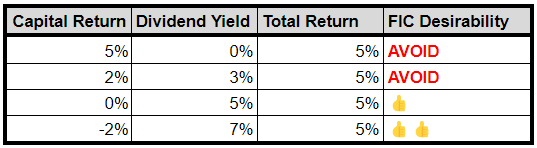
Actually, we’re looking for stocks where most, if not all, or even better, more thanall, the returns come from dividends.
This is because dividends are tax-free to the FIC and capital gains are not. So we want lots of dividends and the minimum capital gains – or even capital losses.
For example, all the assets below deliver the same returns, but the tax consequences are very different. (RIP Modigliani & Miller).
Stocks with high yields that never seem to go anywhere are what we want.
Why do you want to generate capital losses?
The FIC pays corporation tax on any realised capital gains, although we can offset expenses and losses.
Effectively we try to avoid ever paying corporation tax by ‘sterilising’ gains. That is, by only realising them if we have sufficient offsetting losses in some other stock, or running costs.
For this reason we want a portfolio of stocks and not just a high-yield dividend-focused ETF like Vanguard’s VHYL, for example. We’re after some dispersion of returns.
This does still lead to some shareholdings being sufficiently ‘in-the-money’ that it’s hard to have the tax capacity to sell them.
When you see the portfolio in a minute, there’s some stuff that’s been held for a very long time for this reason that is no longer particularly high yield.
Any other constraints on potential stocks?
Yes. It’s very important that the dividends are actually tax free to the FIC. There are some specific examples of cases where they are not. The source of the stock has to be a ‘qualifying territory’ on this list.
Tempted to stuff the FIC full of London-listed infrastructure or renewables trusts? Large capitalisation, high-yield, low volatility – perfect, right?
I’m afraid not. They are pretty much all domiciled in Jersey or Guernsey, and guess what? The Channel Islands are not on the list.
But most proper countries are, including, importantly, Ireland (where most LSE-listed ETFs are domiciled) and the US, with over 50% of global stock market capitalization.
However, and I’m sorry about this, but we need to talk about dividend withholding tax before we go any further.
A word about dividend withholding tax (WHT)
Explaining dividend withholding tax fully is beyond the scope of this post.
But in summary…
Most countries level a withholding tax on dividends. This means you don’t get the dividends ‘gross’. You get them ‘net’ of withholding tax.
For example, the Netherlands WHT rate is 15%, so if a Dutch company pays a €1.00 dividend, you will receive €0.85.
As an individual UK taxpayer you may be able to use the 15% as a credit against any dividend tax you owe in the UK. But as a limited company we can’t, because we don’t pay (UK corporation) tax on dividends anyway.
In theory, the tax treaty may say we can get a reduced rate. But good luck getting your broker to take any interest in that. “Sorry they are held in ‘street’ name”.
You could also ask the foreign tax man for the money back. Good luck with that, too. “Sorry, your broker shouldn’t have withheld the tax in the first place”.
So what does WHT mean for a FIC?
It is a long way of saying that we only really want the FIC to hold stocks domiciled in countries that don’t levy dividend withholding tax.
Significant countries where this is the case are the UK, Hong Kong, and Singapore – plus funds in Ireland.
Hong Kong is, of course, not on the qualified territories list, and Singapore is not very interesting.
So this leaves us with… UK-domiciled companies and Ireland-domiciled ETFs. Although we may break this rule if the (post-WHT) yield is high enough.
The ETF / fund structure doesn’t avoid this issue, by the way, it just hides it. (There’s the exception of ‘swap-based’ ETFs tracking US indices. Maybe we’ll cover that another day.)
Individual US stocks that pay dividends should be held in your SIPP, where you should pay no withholding tax.
We also want to avoid things where the distributions are interest not dividends, because interest is taxable for the FIC.
So we might buy preference shares – although they are usually not marginable – because they pay dividends. But not AT1 bonds, because they pay interest.
Great, but what have you actually got?
I just alluded to another, personal, constraint – I want my stocks to be marginable at IBKR. Which means big and liquid.
I’d also prefer they were denominated in GBP and paid their dividends in GBP because otherwise it complicates the accounts. This is not much of an additional constraint given the dividend withholding tax issues above.
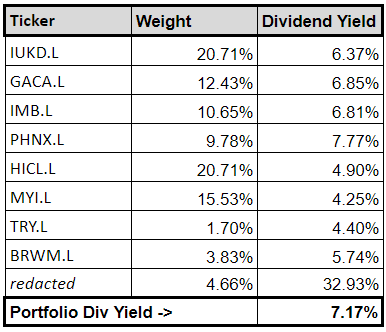
I’m left with a portfolio that looks very much like the sort of thing a classic UK equity income investment trust might own.
What can I say?
GACA is the only non-marginable share. And I think we can all agree there’s not much danger of these stocks going up much.
Aren’t you letting the tax tail wag the investment dog?
Yes, absolutely, I am. But look at it this way – maybe my portfolio outside the FIC is the global market portfolio minus these stocks in these weights?
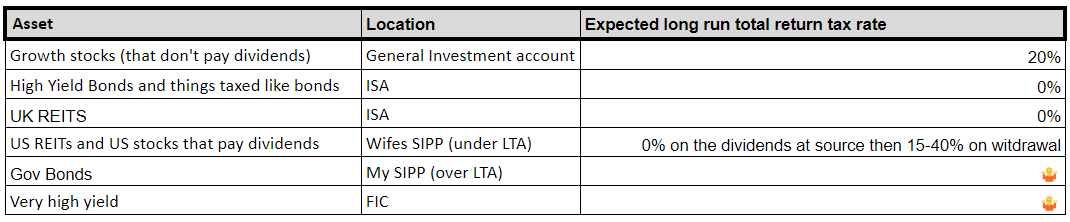
I mean, it’s not, obviously, but it could be.
We’re aiming for this:
How actively do you trade this portfolio?
I have an ambition to go a whole year and not do a single trade. I’ve not succeeded yet. We do a handful of trades a year, but some of these positions haven’t changed in at least a decade.
Do companies still benefit from the ‘indexation allowance’ on capital gains?
Sadly not, this was quietly removed in 2017. In my opinion it made the FIC structure substantially less attractive.
What other expenses can I get away with charging to the FIC?
One way of essentially withdrawing money tax-free is to have the FIC pay expenses that you would otherwise have to pay yourself. (‘PA’ as they say).
These effectively get you, as an individual, ‘tax-free’ money out of the company, and are tax deductible for the company. A double win.
The extent to which you can do this appears to be down to the judgement of your accountant. You have to be able to make the case that it’s for legitimate business purposes.
We don’t do as much of this as we should, probably. The company pays for the occasional bit of computer equipment. “It’s for managing the portfolio!” This is depreciated over three years, so basically we get a laptop every three years.
We could probably expense the Financial Times subscription and our mobile phones, but we don’t.
I once tried to persuade the accountant that the FIC should pay from my MBA, but failed.
Can I expense my accountant’s bill for my personal tax return to the FIC?
No. I guess you could come to an ‘understanding’ with your accountant. One where they overcharge you for FIC work and under-charge you for your personal stuff. But I don’t have that kind of accountant.
Do you hold UK REITS in the FIC?
No. This could be quite a good idea, because the FIC should receive the Property Income Distributions (PID) gross. Although PIDs are taxable.
It might work if we have sufficient expenses. However Interactive Brokers don’t pay the PIDs gross, regardless of what the tax rules say.
Attempting to reclaim them from HMRC is theoretically possible, and something my accountant would be delighted to help me with – at a cost.
We don’t really have enough tax-capacity to make this worthwhile.
Can you have direct properties (buy-to-lets) in the FIC?
Actually, yes! We have one, un-mortgaged, rental property in the FIC. We sold it to the FIC in early 2016. Just before the extra stamp duty for companies came in.
The income from the property is, of course, taxable, but it is tiny. We run enough general ‘management’ expenses to offset the income.
I have thought about moving one of my other buy-to-let properties into the FIC, but I’ve not been able to make it make sense.
To be honest if I’m going to sell it – with all the (personal) tax and hassle – I’d rather sell it to some other mug.
Do you have any other assets in the Family Investment Company?
We once did quite a bit of peer-to-peer lending. You know the sort of thing: Lendy, Archover, Funding ’Secure’.
At least it provided us with a deep well of tax-deductible write-offs.
Could I just use the FIC for all my shares?
You could, but it would likely be a bad idea, especially now that the indexation allowance has gone.
Your minimum tax rate on capital gains is 19% (rising to 25%) – and it could be as high as 54.51%. (The company pays 25% tax on gains, then you pay 39.25% on the dividend to you. That’s: 100 -> 75 -> 54.51%).
You’re much better off just holding those assets in your own name and paying 20% CGT.
This all sounds like a great deal of work. Is it?
I spend less time administering the FIC every year than I spent writing this article.
The ongoing obligations are:
File a ‘confirmation’ statement with Companies House every year. (Takes five minutes. It’s nearly always the same as last year’s).
File accounts with Companies House every year. (The accountant does it).
Prepping the information for the accountant and checking their work takes about as long as it does to do our (again, fairly complicated) personal tax returns.
Filing a tax return with HMRC. (Again, the accountant does it).
There’s a bit of other admin, like renewing your Legal Entity Identifier periodically. (Interactive Brokers does that for us.)
How much does it cost to run?
It costs us about £2,500 per year. This is almost all accountants’ fees.
I know, I know, it should be less than that.
The costs are proportional to the nature and volume of transactions. But they are essentially fixed with respect to the size of your balance sheet.
(That said, I suspect an accountant would charge the £10m company a bit more than a £1m company, even if they did the same amount of activity).
How much do I need to put in to make this worthwhile?
Well, you know the costs now . You do the maths. Maybe £1m, if you’re starting from scratch?
It might be less if you’re using an existing company, or setting up a FIC that has a relationship with your trading company. I’ve never done this though. Once again, seek professional advice.
Can you recommend your accountant to help me set up a similar arrangement?
No.
Does this cause a problem with your employer?
Potentially. My employment contract explicitly forbids me from owning more than some percentage of a company, or being a director of another company, without my employers ‘written permission’.
The key here is to ask for the ‘written permission’ in good time.
I simply asked, by email, for them to confirm there was no problem with the arrangement in the same email I accepted their job offer. I have done this four times now and it’s never been a problem.
This sort of arrangement is a lot more common than you might think. Human Resources have seen it all.
In jobs where I was subject to compliance ‘personal account dealing’ rules, the FIC was obviously subject to the same rules.
Again, never a problem, if you follow the rules.
While we are talking about transparency…
Anyone can go to Companies House, click ‘Search the Register’, put in your name, find the company you are a director of, and look at the accounts.
There is nothing you can do about this. If this is going to cause you embarrassment, then a FIC probably isn’t for you.
Can I pay pension contributions for directors?
Yes, you can, but I’m not sure why you would?
These are ‘employer’ contributions that are made gross to the scheme – and are a tax-deductible expense for the FIC. You’re saving the company 19/25% corporate tax on the contributions, but you’ll pay anything from 15%-55% on withdrawals (from tax-free amount and basic rate all the way up to the LTA charge). So is there any point?
Again, this is a deferral of tax liability, more than an avoidance. It might be worth considering if the FIC is otherwise becoming liable for corporate tax and ‘needs’ some expenses, and if you have directors who are unlikely to get to the LTA and will be basic-rate tax payers in retirement.
But, again, if you’re rich enough to make this structure worthwhile, you probably don’t have those people in mind.
Can I pay salaries to the family members instead of dividends?
Yes. You could make the kids (once they are adults) directors and pay them a salary – although there’s quite a bit of paperwork involved with having employees that I could do without to be honest.
The advantage over dividends is obviously that their salaries are tax-deductible for the FIC – and you’re just using their nil-rate allowance. (I’m assuming you’re only doing this while they are students, basically).
Into the weeds
Can the company pay interest on the director’s loan?
I believe so, but you do have to do some withholding / filing with HMRC. It’s a bit of a pain – and, again, why would you do this? Presumably the last thing the director wants is taxable income?
Can I convert a regular trading company into a FIC?
I get this question quite a bit.
The classic case is the 1990s/2000s City IT contractor type who contracted through a pre-IR35 personal service company. They now have a few hundred grand sitting in their limited company and don’t want to pay dividend tax to get it out.
Be very careful here. There are some reliefs associated with being a proper ‘trading’ company that you may jeopardise.
This, as with every other word in this article, is something you should take proper professional advice on.
How does a FIC compare to some sort of ‘offshore’ arrangement?
I have a high level of confidence that the FIC structure is 100% above board and has zero retroactive compliance risk from HMRC.
This does not mean that the rules won’t change to make some aspect of it not ‘work’ any more.
The only thing I’m confident about with offshore arrangements is that they are expensive to set up.
In any event, it’s not trivial. You can’t just set your FIC up in the Caymans and pay no tax. HMRC will treat any company that is ‘controlled’ from the UK as if it were UK domiciled and tax it accordingly.
I do know people with offshore companies that they don’t ‘control’ – but are controlled by a chain of shadowy proxy entities that they also don’t ‘control’.
I am sure this is all completely legit, the way they’ve done it. But I also don’t have the sort of money that makes this level of risk or complexity worthwhile.
Is a FIC a ‘close company’ and does this matter?
Yes, most likely your FIC will be a close company. There are a few anti-avoidance measures that target close companies specifically – for example, targeting manoeuvres such as you moving abroad for a year and paying yourself a big fat dividend.
Unless you’re trying to use those avoidance methods, being a close company shouldn’t really make much difference.
There have been different tax rules for close companies in the past. This is certainly a potential vector for the government if they wanted to attack this sort of structure.
Is there anything you haven’t mentioned?
Yes – there are a few other tricks that I don’t want to discuss openly on the internet!
Thanks to Foxy Michael, who met Finumuson Twitter and was kind enough to review this article for gross falsehoods. If this Family Investment Company FAQ has whetted your appetite, visit his site. You can also read more from Finumus in his archive, or follow him on Twitter.
Ideally you’d own them in tax shelters, of course, but you might have a larger portfolio or some other reason for owning un-sheltered assets. This brings the FIC into the picture.[↩]
Not the other way around – going overdrawn on the directors’ loan account.[↩]
Often times when somebody goes a little off-piste with their investments, I will make clear in the introduction that this site is for informational purposes only. It is not personal advice as to what you should do. Well, with my co-blogger apparently having gone off his rocker, I’m double underlining that today. Read on for enjoyment – but subscribe to his kind of cool at your peril!
One unfortunate development liable to banjax, derail, or otherwise severely stress-test a financial independence plan is galloping inflation and a cost of living crisis.
Oops! One minute my energy bill was a national average £1,200. The next I was being quoted north of £4,000 1 as my old-skool affordable tariff expired – with me clinging on to it like Rose to a freezing Jack at the end of Titanic.
Time to dust off the emergency action plan I’d devised for precisely this scenario.
Ahh, about that…
Chapter 12: How to respond in the event of quadrupling energy costs.
I found I’d left that page curiously blank. Someone hadn’t covered off all the angles had they?
But I wasn’t entirely naked in the face of danger (and at these temperatures, thank God!)
In fact, my best way out of this, I decided, was to clothe the bejesus out of myself.
Cold comfort
“Wouldn’t it be fun…” I said to Mrs Accumulator in that disarming way that instantly puts her on her guard.
“…if we challenged ourselves to use as little energy as possible this winter?”
Thankfully Mrs Accumulator’s action plan on “How to respond if TA turns out to be an utter nutjob” is also remarkably underdeveloped.
I mean, it’s not as if she hasn’t had fair warning.
Just how low could we go? Both on the thermostat’s dial and in terms of the social unacceptability of our chosen course?
And how many layers of thermals, fleeces, winter woollies, and the very best in technical gear would it take to live comfortably* in a house as warm as a tomb?
*Your mileage may vary.
Enter the Chillbreaker
His and Hers survival suits made everything seem possible.
Get a load of this bad boy:
Several togs worth of quilted, walking sass.
Added bulkpour homme et padded booty pour femme.
Made by Refrigiwear and rocked by Americans working in industrial freezers or extreme Midwestern winters, this quilted beauty was the answer to our prayers.
Indeed I am writing to you from within its cosy confines now.
Polyester fiberfill insulation? Tick.
100% Taslon nylon 3-Ply outershell? Tick.
Storm flaps for the front zippers. Double-tick!
The Chillbreaker comes in any colour you like. As long as it’s Mao’s Workers’ Paradise Blue. Guaranteed to automatically crush any attempts at individual expression or insurrection.
Excellent news! Especially as I wasn’t sure Mrs Accumulator was 100% committed. (And we might both be committed by the time this experiment is done – so that padding could come in doubly handy.)
Have I mentioned the hip length leg zippers? Perfect if you start to boil in temperatures of over 12°C, or want to give a cheeky flash of your thermals.
IWOOT
I know what you’re thinking.
Where can you get one of these dream-makers?
I’m glad you asked.
These babies are not available in the shops. Not in the UK at any rate.
But for a mere $110, plus shipping, import duty, VAT, and handling fee, you too can be the proud owner of your own adult romper suit.
In GBP, they cost us around £243 each. Plus some “can you ship to the UK hassle?” with US vendors.
But let’s not get bogged down in the details. The goods should pay for themselves in cubic metres of gas not burned.
So has the plan ‘worked’? (Put that in scare quotes, please – Ed.)
Do we live in an icebox sustained by our suburban space suits and balaclava helmets?
Does net zero now refer to the temperature of our house?
The icebox challenge
This was the temperature reported by my smart thermostat during the depths of the December cold snap.
The outside temperature was -8°C while inside at Chez Accumulator we were enjoying a positively balmy barmy 6.6°C.
I could tell I was still breathing because I could see it. Great gusts of exhaled air condensing into fog. Fun.
Actually somehow it was fun.
A greater challenge than living at 6.6°C will be persuading the sceptics that I’m not living in frostbitten misery and that Mrs Accumulator hasn’t left me for any dude with his thermostat set to 21.
But let’s give it a go.
Draught dodgers
A big part of what’s made this work is we set it as a challenge for ourselves. One that we’re solving together, while taking it in stages, alongside regular check-ins to make sure neither of us is hating life.
Starting in late October we rationed ourselves to two hours of heating a day in the morning.
When it’s freezing outside, our draughty old Victorian home struggles to get over 17.5°C, even with the heating on 24/7.
We’ve never been able to ponce around in T-shirts and pants in the depths of winter anyway.
In student days, we spent one winter in a flat sans central heating. And we have heard plenty of tales from boomer parents about nights spent huddled together in front of the one fire in the house.
Britons didn’t used to live in dwellings heated to 21°C. More like 12°C.
That sounds bleak by today’s standards. But we started out thinking no more ambitiously than: “Let’s find out what we can put up with. Let’s save some energy. Let’s put the money to better use than heating a house that doesn’t want to be heated.”
And we wouldn’t be eschewing all mod cons – as the short, sharp fashion parade above makes plain.
A big difference between Britain today and Britain before central heating is that most of us can now afford whatever clothing it takes to give us a personal tog-rating worthy of a double duck duvet.
Just chillin’ in my crib
The science of thermal insulation using clothing is also now widely understood. Indeed you’ll know most of it already.
The bulk of the work is done by wearing three distinct layers:
The base layer that wicks moisture away from the body. Ideally this is made from merino wool or appropriate synthetic fabrics.
A thick insulating mid-layer that traps air. Think heavy wool jumpers (as worn by a fisherman) or a fleece. (Those sheep know what they’re doing).
A windproof outer layer. Not needed indoors unless your windows are outrageously gappy.
There’s even a US unit of measurement of clothing insulation called the ‘clo’.
A warm clo inside
You can award every garment you’re wearing a clo rating. Add up your clo units to find out whether your outfit can handle the prevailing temperature even as your sweet backside is parked on the sofa.
That last distinction is not only a beautiful image. It’s also a crucial part of maintaining our thermal comfort zone.
Experience tells us that our 21st Century sedentary lives do not help us stay warm.
But 1 clo’s worth of clothing is enough to keep humans comfortable at 21°C while at rest.
An example of a 1 clo ensemble is a military uniform. A three piece suit – plus undies – is also worth a clo.
Interestingly, 1 clo equals 1.55 togs, which is the British unit we know and love from our duvets.
Anyway, every extra clo you wear means you can comfortably lower the temperature another 1°C. Which saves another 10% in energy use.
A superb article called Insulation: first the body then the homeby Kris De Decker shows you how to use this clo-business to throw together outfits from your wardrobe that can handle any temperature.
But I didn’t do any of that.
I just kept piling on layers as the thermostat ticked down like the depth gauge in a bathysphere:
16°C – a comparative doddle.
14°C – was totally bearable. I took to wearing my woolly hat indoors.
12°C – felt quite hardcore. Mrs Accumulator and I exchanged glances. Neither one of us caved.
10°C – I appeared on Zoom wearing full body bag, muffler, and hat. My mum pished herself.
8°C – I regularly popped a hot water bottle down my padded pants. If this thing burst I was done for.
Mrs Accumulator sensibly used a microwavable heat pack instead. No third-degree crotch burn danger for her.
How are we doing now? Still smiling?
I couldn’t believe it. Though we needed to adapt at every stage we were both completely comfortable.
Granted, I felt cold at times. But no more than living in this house during a normal winter – when the heating was on full blast but we didn’t think much about what to wear.
The heat pack is genius. As long as your core is warm then that good-time glow extends to your hands and feet.
We both spend too many hours tapping into keyboards (witness the waffle above.) But even that’s not a problem at 8°C when you’re inside a heated Chillbreaker.
And it’s never going to get any worse than that. Because it transpired 8°C was our minimum room temperature provided we got two hours of heating. And that on the coldest day ever recorded in my part of the world. (Right now it’s 5°C outdoors and 12°C indoors.)
You quickly adapt to a new mean temperature. (With the emphasis on the mean.) I used to feel chilly at 17.5°C. Now that temperature seems like tropical spa break luxury.
And how’s Mrs Accumulator holding up?
She just challenged me to do without our two hours of daily heating.
Gulp!
Back to The Good Life
I’ve told you this story for your (possible) entertainment. It’s not meant as a “Come on Britain, put your bloody backs into it!” polemic about how we’ve become a nation of softies.
I’d prefer to live in a Putin-less world of wind turbines and heat pumps keeping us all toasty. One in which the Chillbreaker remains hanging on its peg because power is too cheap to meter.
Nor do I think state-sponsored Selk’bags should be compulsory for the frail and elderly, the very young, or those with illnesses exacerbated by the cold.
If we have visitors then we don’t write “dress warm” on the invite. We crank up the heating to make everything seem ‘normal’ by the time they arrive. We get that not everyone will dig our ‘frugal casual’ look.
But you’d be mistaken if you read into this a tale of forced frugality and the folly of FIRE. We could burn the cash on heating if we wanted to.
We’ve just got better plans for it.
Take it steady,
The Accumulator
Bonus appendix
Our annual energy bill looks like it’ll tot up to around £1,200 on the standard rate if we stick to our current regime. That’s roughly what we would have paid before the energy crisis.
Whereas our energy provider is now estimating £2,750 for the year if we opened the gas taps like it was 2021.
If anyone would like to buy a Chillbreaker, then may I recommend purchasing from Legion Safety. They were the one company I found in the US who would (a) send the goods to the UK and (b) charge a reasonable shipping cost.
Their online reviews aren’t uniformly brilliant, so I thought I was taking a chance. However, Legion’s customer service was very good. Getting the item through UK customs was straightfoward, too.
I’ll write a brief guide in the comments if anyone’s interested.
There is a French company who will ship Chillbreakers, too, but it was more expensive.
I’d also love to hear people’s thoughts on alternative outfits. Sleeping bag suits look viable. What about skiwear?
Finally, apparently the British unit of insulation, the ‘tog’, was derived from ‘togs’, the classic slang term for clothing. Togs was borrowed in turn from ‘toga’ – the Latin word for the famed Roman fashion item. Love that.
This was before the UK Government’s Energy Bills Support Scheme was announced.[↩]