During the previous Trump term, the first thing I did every morning was look at the news on my phone – just to check he hadn’t blown anything up.
I made a deal with myself that I wouldn’t do that again through Trump Part II.
Well, that’s over, as is much of what we’ve taken for granted about the US-led international order that’s underpinned Western prosperity since World War 2.
Partisan bias causes people to be more negative about the economy whenever their ‘side’ is out of power. But at least in the past I always believed that any US President had a vested interest in the common good. There was always a hope their policy medicine could work, even if I believed it to be harsh, or likely to cause bad side-effects.
Sadly, Trump’s medicine is all side-effects and no therapeutic value. It’s the hydroxychloroquine of economics.
And this time, there’s nobody in Trump’s administration to tell him it’s a lose-lose idea. Or to at least distract him with some less important toy to break.
Trump tariffs tantrum
The market’s verdict is clear. Here’s the stock market slide as represented by various ETFs, with Trump’s Ruination Day tariffs listed per country (black text on each bar):

Equity ETF returns per country from 2 April to 4 April 2025. Source: JustETF. Not shown: 41% tariffs on the Falkland Islands, 0% on Russia, 50% on mighty Lesotho, 10% on Penguin Island. 1 10% on British Indian Ocean Territory – inhabited by US and UK military personnel only.
Two things stand out, aside from it being a global bin fire.
Firstly, the US market is one of the worst affected.
Secondly, at the time of writing there’s little correlation between the size of Trump’s tariff and the impact on individual country stocks. 2
For instance, the Australian market is down over 10% after a 10% tariff slap. Yet Vietnamese firms ‘only’ dropped 5.8%, despite Vietnam’s 46% tariff clothesline.
Meanwhile the UK’s FTSE All-Share lost 6.3% – even though we supposedly got off lightly.
Tis but a flesh wound
Nobody knows if Trump will walk some of this back or escalate. His advisors don’t know. He probably doesn’t know himself.
More to the point, nobody can predict how business and consumer confidence will bear up against the turmoil and anxiety. But it’s hardly the time to splash out is it?
Perhaps deleting all our news and stock market apps is the way to go – because here’s one way to view the decline:

A 5.9% loss since the start of January this year only sets the Slow & Steady portfolio back to March 2024. That doesn’t even rank among the top five worst quarterly losses in our model portfolio’s short life.
The portfolio’s worst drawdown was -14.9% in 2022. And we haven’t actually experienced a proper bear market loss since gunning up the portfolio more than 14 years ago.
That’s a blessing! But it also means that many of us haven’t been truly tested yet.
Risk matters
William Bernstein advises investors to use their first bear market as a reality check – a verification of your actual risk tolerance.
If you panicked last time, then Bernstein thinks you should ease back on equities and beef up your bonds so you’ll find it easier to handle the next go around.
But what happens if you haven’t previously experienced a bear market for equities – but you did recently suffer a hideous bond shock?
My guess is that some of us are in over our heads on the equities side, having grown leery of bonds. Perhaps we’re relying on diamond hands that could to turn to jelly in a real rout.
That happened last time during the Covid crash. Some of the Monevator community fled the field.
Granted, the market in March 2020 was going down like a lift with its cable cut. Yet equities bounced back within five weeks.
That was then…
If you’re feeling a grim sense of foreboding then I’m right there with you. But if you’re feeling scared or downright sick at the thought of what could happen next then you’ve got a couple of viable choices.
You could pare back a little on risk. Swap, say, 10-20% of your equities for bonds and/or cash.
Things could easily get even worse from here – though nobody knows for sure – so perhaps take a hit now to stave off being completely broken later.
Alternatively, brace yourself and hold on for dear life.
There should be a stock market pain simulator out there but this chart is the best I can do:

Bull and bear markets over time (US). Source: Vanguard
Take a long look at those negative numbers, and at how many years you might have to wait to turn the corner. Can you live with that?
If you can, then you should eventually be rewarded with one of the successive growth eruptions that dominate the chart.
Maybe sooner. Maybe later. Who knows where this goes next? The adults are not in the Situation Room.
But some day they will be again.
So if you’re not ready to bail, if you’re in it to win it, then you’re gonna have to take some pain. Grit your teeth, pull down your tin hat, and pledge that you won’t sell.
Here’s a fortifying tweet – quoting Barry Ritholtz’ new book – that might help:
There’s never any 100% guarantees. But history is on the side of investors who’ve held fast for the long-term.
How’s the Slow & Steady doing?
Everything is down in our model portfolio for the quarter, except for bonds. At least something is still working!
Here are the latest numbers (as of 4 April – a long time ago):

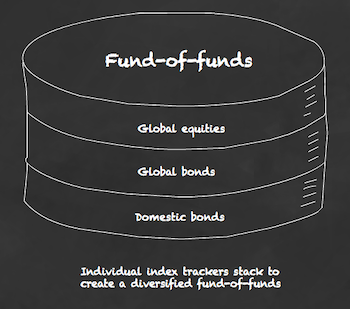
The Slow & Steady is Monevator’s model passive investing portfolio. It was set up at the start of 2011 with £3,000. An extra £1,310 is invested every quarter into a diversified set of index funds, tilted towards equities. You can read the origin story and find all the previous passive portfolio posts in the Monevator vaults. Last quarter’s instalment can be found here.
New transactions
Every quarter we throw £1,310 of red meat at the wild dogs of the market. Our stake is split between our portfolio’s seven funds, according to our predetermined asset allocation.
We rebalance using Larry Swedroe’s 5/25 rule. That hasn’t been activated this quarter, so the trades play out as follows:
Emerging market equities
iShares Emerging Markets Equity Index Fund D – OCF 0.2%
Fund identifier: GB00B84DY642
New purchase: £104.80
Buy 53.571 units @ £1.96
Target allocation: 8%
Global property
iShares Environment & Low Carbon Tilt Real Estate Index Fund – OCF 0.17%
Fund identifier: GB00B5BFJG71
New purchase: £65.50
Buy 29.39 units @ £2.23
Target allocation: 5%
Developed world ex-UK equities
Vanguard FTSE Developed World ex-UK Equity Index Fund – OCF 0.14%
Fund identifier: GB00B59G4Q73
New purchase: £484.70
Buy 0.783 units @ £618.94
Target allocation: 37%
UK equity
Vanguard FTSE UK All-Share Index Trust – OCF 0.06%
Fund identifier: GB00B3X7QG63
New purchase: £65.50
Buy 0.242 units @ £271.17
Target allocation: 5%
Global small cap equities
Vanguard Global Small-Cap Index Fund – OCF 0.29%
Fund identifier: IE00B3X1NT05
New purchase: £65.50
Buy 0.170 units @ £384.75
Target allocation: 5%
UK gilts
Vanguard UK Government Bond Index – OCF 0.12%
Fund identifier: IE00B1S75374
New purchase: £301.30
Buy 2.253 units @ £133.75
Target allocation: 23%
Royal London Short Duration Global Index-Linked Fund – OCF 0.27%
Fund identifier: GB00BD050F05
New purchase: £222.70
Buy 204.688 units @ £1.09
Target allocation: 17%
New investment contribution = £1,310
Trading cost = £0
Average portfolio OCF = 0.17%
User manual
Take a look at our broker comparison table for your best investment account options.
InvestEngine is currently cheapest if you’re happy to invest only in ETFs. Or learn more about choosing the cheapest stocks and shares ISA for your situation.
If this seems too complicated, check out our best multi-asset fund picks. These include all-in-one diversified portfolios such as the Vanguard LifeStrategy funds.
Interested in monitoring your own portfolio or using the Slow & Steady spreadsheet for yourself? Our piece on portfolio tracking shows you how.
You might also enjoy a refresher on why we think most people are best choosing passive vs active investing.
Take it steady,
The Accumulator