What caught my eye this week.
I was a big fan of real-time strategy computer games in my frugal but otherwise misspent youth.
You know – those games in which you’d martial digital resources and deploy armies to expand your burgeoning industrial-military complex (or gold based goblin empire).
At their best, real-time strategy games gave you a glimpse of what it was like to be Napoleon or Marcus Aurelius – commanding legions!
At their worst, they were invariably broken by glitches that threw the whole illusion out of whack.
For example, weapon combinations whose lethality escaped the game’s bug testers and made your troops invincible.
Or technology tree choices that exponentially repaid whatever you put into them, giving your faction near-infinite riches while your computer opponent was still rubbing two sticks together.
Triple-lock turns the screw on UK finances
I thought of these glitches when considering the fuss over the triple-lock for pensions. As Simon Lambert noted in ThisIsMoney (my bold below):
The government made a deal in its manifesto to stick with the triple lock, which raises the state pension by whichever is the highest of consumer prices inflation, average annual wage growth, or 2.5 per cent.
It uses September’s inflation figure but July’s average earnings number, and this week the UK’s public finances watchdog, the Office for Budget Responsibility, warned that the latter could trigger a shock £3billion bill.
This would come from pensioners getting a bumper rise due to a quirk from the coronavirus crisis.
Average earnings figures are temporarily being distorted by furlough, lockdown job losses and a comparison to pay cuts in the depths of the crash a year ago, meaning that average wage growth is currently coming in at a high level and rising.
Annual wage growth climbed to 5.6 per cent in the three months to April, according to the latest official figures, and the crucial three months to July figure could hit 8 per cent.
That’s a very nice uplift for doing nothing different if you can get it. But the triple-lock wasn’t meant to occasionally throw up three melons on the slot machine of financial life like this.
An 8% rise after everything we’ve been through looks like a classic glitch.
Still, it’s worth remembering the triple-lock has otherwise delivered roughly what it was meant to.
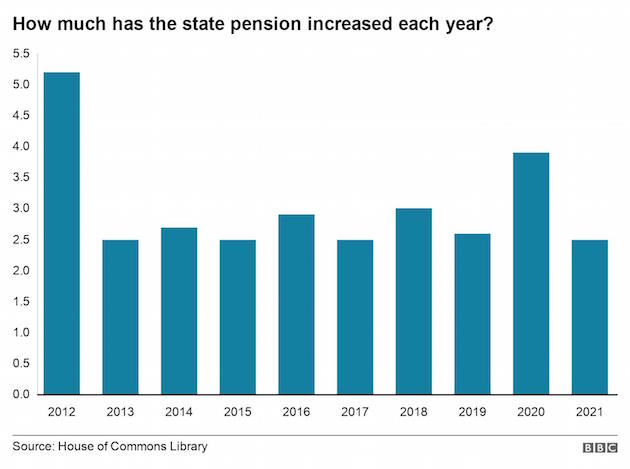
The State pension has increased ahead of average earnings since the triple-lock was introduced in 2011. This halted an ongoing decline in relative terms that was previously making pensioners ever poorer.
And that outpacing has come even though in most years the State Pension has only increased by 2.5%, as cited by the BBC:
 That’s the great thing about guaranteed increases from a mechanism like the triple-lock, at least if you’re not the one who has to pay for it.
You always get some cream, without ever suffering a sour year.
Screw who
With that point conceded to the triple-lock, an 8% rise does look dumb.
David Willetts, the president of the Resolution Foundation think tank, argues the annual earnings link should be replaced by figure that better reflects workers’ experiences of pay increases and declines:
“The Covid crisis has laid bare the design faults of the triple lock, with a severe jobs crisis last year inadvertently contributing to an unnecessary and unjustified 8% rise in the state pension next year.
The chancellor should take the opportunity this autumn to replace the triple lock with a smoothed earnings link.
This would mean the state pension would rise in line with the living standards of working-age people – a change that would be fair to all generations.”
You may remember Willetts was the unusually bold former Tory minister who in 2011 published The Pinch – a book highlighting potential inter-generational fallout from the good fortune of the Baby Boomer generation.
Since then Boomers have only gotten richer, and pensioners could now see an 8% uplift to their state income in the wake of millions of their grandkids being (rightly) ordered to stay at home, in large part for the sake of the elderly.
True, the UK’s State pension is not especially generous. Those who rely on it are not the same people that Willetts and others finger for hoarding an undue proportion of the nation’s wealth.
On the other – other – hand, one can argue today’s pensioners already had their chance to save during three decades of prosperity.
In contrast, today’s young now have to save for their future – at a time of financial crisis, lockdowns, globalization, Brexit, and near-zero interest rates, with houses unaffordable to most to boot.
But how many hands have you got? Because yet another point is that pensioners vote.
Something their favourite newspapers have pointed out repeatedly in calling for the 8% rise to sail through.
Pick your pension poison
It seems to me the 8% uplift is clearly a bug caused by unforeseen circumstances. In software terms, it needs a patch to update it.
However it’s also true the triple-lock was introduced to stop the state pension becoming inadequate over many decades of longer retirements and rising living standards. We all know that story.
Pundits who’ve never seen a state benefit they didn’t want to double argue we should all want to retain the triple-lock, because today’s young people will benefit from it in their old age, too.
Whereas ironically, many young people suspect they’ll never get a State pension – partly due to its high cost funded by a shrinking pool of workers.
A cost that could be made even worse – to the tune of £3bn forever – by this glitchy 8% uplift!
Finally, we have speculation – see my links below – that chancellor Rishi Sunak is looking to claw back money by further reducing the amount you can put into a private pension or by cutting the tax relief you receive.
You don’t need to be Daniel Kahneman to see that all this tinkering with the rules that govern payouts that you won’t receive for decades is deeply sub-optimal.
Pensions 2.0
I’m not especially old, and I’ve seen big pensions changes in my lifetime, myriad tweaks, and annual speculation that this allowance will be chopped or that relief will be scrapped.
That’s not even to get into the shifting age limits as to when you can get your hands on your money.
It’s pretty ridiculous.
Indeed I’m starting to wonder if we shouldn’t do a hard reboot towards a system so simple that everyone understands it – making it harder for future politicians to meddle with – albeit at the cost of more turmoil today.
I haven’t attempted to cost out the following idea, but in theory it could sweep away a lot of this ongoing nonsense in one go.
We evidently believe as a society that old people should have a minimum standard of living.
We also believe younger people should know they have a comfortable future to look forward to, for all kinds of good reasons.
Finally, we understand it’s incredibly difficult to make any forecasts and commitments about the far future – financial or otherwise.
Funding your retirement been described as the hardest problem in finance, due to all the uncertainty.
But perhaps the one entity that can make firm commitments is the State, backed as it is by taxpayers.
So – maybe we should set a universal state pension at a much higher level than today’s payout. Say 50% of a median workers earnings.
That would deliver a State pension of about £15,000 a year right now, compared to less than £10,000 under the current system.
Wow, right? But how do we pay for it?
Well for starters we then scrap the entire artifice around private pensions and tax relief.
All of it. Everything.
People could still save and invest whatever they liked in the usual way, of course. There would be no prohibition on aiming to be a multi-millionaire in your old age.
But the government wouldn’t help you get there.
So there’d be no private pensions. No annual allowances or tax-free lump sums. No crystalization events or similar. No tax wheezes at the margins.
All gone, at a huge (though possibly not sufficient) saving to the government of time, money, and bureaucracy.
Possibly ISAs could remain. We’d have to do the sums. But before you get too indignant, remember you’d be getting that far bigger state pension, too.
Don’t worry, be happy
Obviously the lower-paid and poorer would gain the most though from this system. I’m not sure that’s a bad thing, given the direction of travel of society over the past 20 years.
But richer people like most of us are (or will be) would benefit, too.
Our retirement plans could be built on stronger foundations. Difficult choices about whether to lock money away and what would happen to it would be replaced by simply saving as much as you could and wanted to.
Billions would be saved in accountancy costs and other fees.
One snag would be it would make the Boomers even richer. The wealthiest cohort of society would suddenly get a far higher State pension despite not paying much towards it. (They’d pay something – they pay tax, remember).
Perhaps we’d need a windfall wealth tax to smooth the transition? If that meant Boomer retirees short on liquidity moving out of their mostly empty five-bedroom homes to release capital or whatnot, that’d probably be a good thing, too.
Now as I said I haven’t costed out my alternative pension system.
Why bother? Even if I was an elected MP there’d be zero chance of it being implemented.
But I think it’s worth thinking about big alternatives to this ongoing muddle.
Otherwise we will battle on for years with shifting rules and benefits and a future target that looks more like a swarm of bees than a bullseye.
More patches and glitches – and the occasional threat of a crash – forever.
Good business for financial planners, politicians, and tax specialists. Not bad for money bloggers, either.
But a pretty dumb way to encourage people to plan their way through life.
Have a great weekend everyone. Stay hydrated!
[continue reading…]