When do fund fees drop so low that it’s not worth the hassle of switching to a cheaper fund?
Naturally that’s a personal decision. But there does come a point when sweating the difference between two cut-rate options has a vanishingly small impact on your future wealth.
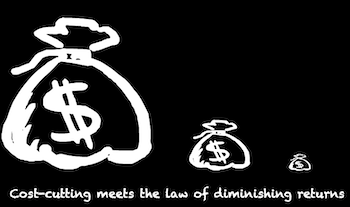
That point arrives when the cost of a fund in pounds falls so low that even moving to a rival that’s half the price makes little material difference.
The numbers bear out this apparent heresy – and I say this as someone who had it drilled into them that investment costs were to be crushed like infidels on the wrong side of a holy war.
What’s the cost in raw cash money?
To see how the diminishing returns of fee-relief set in, we have to assess fund costs in cash terms, as opposed to comparing the relative difference in their ongoing charge figure (OCF) percentages.
For example, let’s compare the fate of £10,000 invested in three funds for 30 years. I assume each fund returns 8% a year before these fees:
- Fund A’s OCF is 0.05%
- Fund B charges 0.25%
- Fund C whacks its investors for 1.25% per year
Fund B is fives times cheaper than fund C.
Similarly, fund A is five times cheaper than fund B.
However switching from fund B to fund A matters much less to your final investment outcome than making the leap from fund C to fund B would.
The Final investment pot line in the table below shows this clearly:
| Fund | A | B | C |
| Fund OCF (%) | 0.05 | 0.25% | 1.25% |
| Fees paid year one (£) | 5 | 25 | 125 |
| Final investment pot (£) | 99,238 | 93,868 | 70,963 |
| Total fees paid (£) | 1,388 | 6,758 | 29,663 |
Your final pot is 32.3% bigger if you invest in fund B not fund C. That’s huge!
But your final pot is only 5.7% bigger if you invest in fund A instead of fund B. Not so huge.
That 5.7% extra is useful for sure. But it’s probably not worth Force-choking your fund manager like Darth Vader whenever a competitor undercuts them by a basis point.
The fund fee drag factor
Ultimately, it’s the high cost in pounds of fund C that exacts an extreme toll, relative to the 8% per year earning power of your investment.
For example, all three funds above earn £800 on the £10,000 invested in year one.
But the proportional amount of that return trousered by the fund managers is very different as the fees scale:
| Fund | A | B | C |
| Fees paid year one (£) | 5 | 25 | 125 |
| Fee deduction from £800 year one return (%) | 0.63 | 3.13 | 15.63 |
Fund C swipes nearly 16% of your return in year one! That clearly hurts, and so reducing that loss to just 3% by running into the arms of fund B is well worth it.
However jumping ship again to fund A is much less of a win as the charges rush towards zero.
That’s because it’s the absolute difference in pounds that we care about. Not, ultimately, whether one fund is half the price of the other.
Metaphorically-speaking, you might be incentivised to drive an extra mile down the road to save £10 on filling up your car. But you may not bother for a quid off. Especially if there are plenty of other ‘to dos’ in your life that are screaming for attention.
I guess that the point of indifference to savings is related to the gallingly minor happiness boosts we feel when spending on upgrades.
For instance, having a phone is a very useful thing. But buying a new phone with a slightly better screen resolution? Who cares?
The absolute difference is barely detectable.
Running the numbers
Next time you want to see what difference fund fees could make, you could try using an investment fee calculator like the one offered by Dinky Town.
Play around and you will find that:
- The lower your returns, the more fees matter.
- The longer your time horizon, the more fees matter.
- Fees matter less the more your outcome relies on future monthly contributions, as opposed to your current investment balance. That’s because negative compounding has less time to do its dirty work.
More mathematics
Do a breakeven analysis when selling an unsheltered fund exposes you to capital gains tax.
Transaction costs and time out of the market can also potentially swamp tiny savings. (That’s much less of a consideration if you’re just switching between ETFs with minimal spreads.)
Once index tracker fees shrink low enough, tracking difference and variations in underlying holdings may become more decisive factors when weighing up two alternatives.
Spot the difference
You can get a grip on tracking difference by plotting a fund against its comparison index using Trustnet’s multi-plot charting tool.
Our fund comparison post explains how to add the correct index to your chart. (See The impact of the index section of the article.)
Tracking difference is a useful gauge of management efficiency. It’s a positive sign if a fund provider’s trackers typically cling tightly to the index. That’s what we want, so sometimes I’ll check a sample of a provider’s products to help me decide if that’s something they’re good at.
By contrast, the future variation in returns caused by rival funds’ divergent holdings is a crapshoot. The difference can be wild in sectors like gold miners or commodities, or marginal in categories like global tracker funds.
Past returns may tell us that a particular index configuration is flawed, or it could just be that some component suffered a losing streak that might flip into a hot hand at anytime.
Sometimes, if you dig deep enough, you can uncover reasons to believe that certain indexes or products contain inherent weaknesses.
Vanguard LifeStrategy 100’s home bias counts against it so long as the US stock market reigns supreme over the UK’s, for example.
Meanwhile, synthetic S&P 500 ETFs consistently outperform their physical counterparts due to an in-built tax advantage.
A cost of doing business
Transaction costs are another factor to investigate if you want a fuller picture. They can be as large as the OCF in some markets.
However these fees tend to fluctuate a lot and are hard to pin down.
Hargreaves Lansdown is a good source to research transaction costs. Navigate to a fund’s web page on the Hargreaves’ site. Go to the Costs section and you’ll find transaction fees nestling in the Investment Charges dropdown menu.
Your mileage may vary
Costs do matter. The difference between a 0.25% and 1% OCF fund is significant. But the wealth leakage from a 0.25% fund versus cheaper models is much less of a biggie.
After all there’s only so much time in the day. Beyond a certain point, relentlessly chasing fee reductions is more Captain Ahab than Martin Lewis.
By all means keep optimising until you’ve had your fill.
But if you’re losing the will, then take heart. If you’re passively invested in a portfolio of low-cost index funds and ETFs then you’re already well ahead of the game.
Take it steady,
The Accumulator


Very good that, I have just created a portfolio that slightly mirrors Vanguard 60 . Vanguard ongoing fees about 0.22% , mine are about 0.32 %
It did concern me a bit but all being equal it doesnt really matter.
Thanks for the confirmation
Perhaps I’m being pedantic, but I don’t think the total fees paid row isn’t actually correct. You could describe it as “total impact of fees”, but because the portfolios with higher fees grow more slowly, this reduces the total fee in pounds and pence over the 30 years.
I get the following as the total fees paid (assumes fees are paid based on the balance at the end of each year):
.05%: £605.87
.25%: £2,915.10
1.25%: £12,051.63
More practical insight – many thanks.
On slight tangent: when if comes to no-cost options like Trading 212 and InvestEngine are there hidden issues?
I believe neither offer in specie outbound transfers – so stocks and shares ISA investments cannot be transferred to another platform within their tax wrapper. You have to sell and convert to cash first.
Not sure if it’s possible to convert to a cash ISA to keep ISA allowance. But either way not ideal. Even if transfers across platforms infrequent based on buy and hold, etc.
Full disclosure: I’m a Maven masquerading as a Mogul (and very happy to pay my subs). But this does mean I may well have this wrong. As a passive indexer I know the limits of my understanding.
Great article.
I went through this comparing funds on Prosper with their fee rebate offer covering fund fees and transaction costs for select funds. A mix of trackers covering developed market large and mid caps (rebate), global small caps (no rebate) and emerging market large and mid caps (no rebate). It got the total portfolio cost down to almost nothing vs the FTSE Global All Cap.
I carried on with this for a few months but eventually the hassle of managing the allocation wasn’t worth the fees for me over just buying Vanguard’s FTSE Global All Cap index fund, so I sold out and purchased the index instead.
Broker mechanisms for managing automated payments are also helpful in drilling down on fees like this too. I found with Prosper you can’t seem to automate the trades, only loading money into a virtual wallet. You then manually deposit from the wallet into the ISA and place whatever trades you want. Contrast with HL where I can specify what trades I want, how much I want to spend and it’ll take the money and automatically make the trades in the proportions I’ve specified. Definitely easier in some places than others even with the diminishing returns for doing so.
Certainly more straightforward comparing two funds tracking the same index though!
@CP
Trading 212 do offer in specie transfers in and out for their Stocks & Shares ISA. You have to sell down any fractional shares to the nearest whole share though. Outgoing transfers have to be in full.
InvestEngine currently only seem to allow in specie transfers in, not out, but they’re claiming it’s coming.
I think with any broker it comes down to transparency around what they’ll offer. Most of the free brokers I’ve looked at seem quite upfront about what they’re offering with regard to transfers, even if they’ve been more limited at launch vs more established brokers.
Many years ago -30+ – as I started out on my investment career a kindly IFA gave me a graph showing the effect of his fund fees on my final pot after 30 years -reduced my final pot by over a third!
Even the IFAs were financially naive in those far off days-I never saw that graph again
I remarked to my wife at the time that I obviously had plenty leeway for errors if I did investing by all by myself and I never actually consulted an IFA again
Had and are having a good retirement (23 yrs rtd-aged 79)
Things are very different and much better now in the U.K. -the Americans in those far off days as usual were far ahead of the U.K. on private finance and I learned my initial stuff mostly from the Vanguard Diehards forum now the Vanguard Bogleheads
xxd09
@xxdo9 – I had a similar experience 18 years ago when consulting an IFA. The fees ate the gain. It didn’t make any sense. Why would I bother investing? I pointed this out and he took out some ‘protection’ that made the figures look somewhat better. My trust was shattered by that point so I decided to work it out for myself.
@Griff and Hapshade – yes, in many respects continuing to grind down costs is fighting the last war. If you mostly own a portfolio of plain vanilla trackers and keep transaction costs under control then the 80/20 rule is already working for you.
@CP @Hapshade – Just had experience of not being allowed to transfer a Vanguard ETF to Trading212 from AJBell in specie. 212 claim it is a clearing house issue. The fund was apparently held through CREST with AJBell but Trading212 claim to only use Euroclear and so I would need to convert to cash to transfer. Does this make sense to anyone in the know or is it BS? Has it anything to do with the fact that 212 uses Interactive Broker as its prime custodian?
@Always Late From what I’ve read there are issues with in specie inbound transfers between several platforms if they happen to not recognise each other (as with cash ISA transfers). Wiser Monevator will know more than me about this.
As regards InvestEngine, it does look like a more general issue/problem with in specie outbound transfers – Google the issue and there’s seems to be an ongoing comments debate. But maybe it’s resolved now.