Given that investors’ emotions move in cycles from fear to greed and back again, two obvious questions to ask are “Where are we in the cycle now?” and, as greedy asset gatherers, “How can I make money from it?”
Entire books have been written about slumps and bubbles.
For this post we’re going to make do with a few over-simplified graphics.
Investor’s emotions in graphic form
Note that in the different attempts at visualizing investors’ emotions that I’ve collected below, you won’t find any shots from charting tools or similar
While I’ve no doubt that investors’ emotions do cycle, I’m very doubtful that many people can take short-term advantage of it through charts. So no double-tops, candlesticks, death crosses or any such technical analysis bric-a-brac here.
Rather, the main benefit to understanding emotions and investing is to know yourself better.
Once you appreciate how psychology moves the markets – and can influence yourself – it should help you stick to your plan, whether it be sensible passive investing or more hands-on active investing antics.
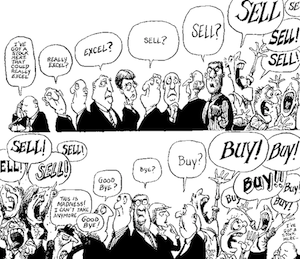
Greedy buying, fearful selling

Nobody is immune to the cycle of fear and greed. Even the greatest investor can get carried away, or else be made miserable by a deep market downturn.
From euphoria to despair
 When I wrote that I thought the markets were a clear buy in March 2009 for anyone who was ever going to buy shares, I got nasty comments across the blogosphere.
I don’t mean “yeah, perhaps, but I don’t think he’s right”. I mean suggestions I was part of some secret narco-government backed plan to ramp up the market to make the last few people with any cash insolvent.
The nicer ones just said I was an idiot.
That’s what the bottom of a bear market looks like. (While I was confident it was a buying opportunity, I won’t pretend to have known the subsequent rally would come so swiftly!)
Nobody rings a bell at the top

This is the same graph as above, really, but I like how the creator has put in the shaded areas. This stresses that there’s a phase of euphoria and of despair, rather than a single event that marks the top or bottom.
For instance, where are we as I write in June 2019?
It’s complicated!
In terms of the US shares that make up the largest part of the assets of a global tracker, I’d guess we’re somewhere between exhilaration and euphoria.
That’s hardly the case for the Brexit-blighted UK market though. With domestic-facing stocks especially, it feels like we’ve been trudging through the denial to capitulation stage for at least three years.
As for the rest of the world – ex-US – I’m torn between thinking we’re sitting on an upswing at the optimism point, or sliding down the other side of the graph into pessimism!
The following graph is illustrative. It shows the divergence between the valuation of US shares and the rest of the world:

Source: Morgan Stanley
In other words, the US stock market looks very expensive compared to the rest of the world but – like the similar divergence between growth and value shares – this relative costliness has been the case for years now.
Timing a reversal is hugely difficult. Most investors will do better to stick to a passive investing plan.
Blast from the past: In the 2010 version of this article, which I’m updating in 2019, I judged global markets sat somewhere between hope and relief. I wrote: “If I’m right, then the masses who are still waiting for an optimistic mood before buying will pay a steep price in forgone returns.” History has shown that was true, demonstrating at least the potential for making a ‘precisely wrong but roughly right’ long-term forecast. (Or, alternatively, proving one can get lucky now and then!)
It’s less risky to buy something unwanted

Most active investors, for their sins, need to pay attention to sentiment – otherwise they’ve no business active investing.
It’s usual better in the long run to buy an asset nobody currently wants, mainly because you might get it cheap.
If it’s cheap then there’s less far for it to fall, as well as much higher for it to climb.
Also there’s probably not much optimism ‘baked into’ the price. That means there’s potential for something unexpectedly good to happen, which could lead to a reappraisal of the asset’s value.
In contrast, buy something everyone loves when everyone is buying, and if it disappoints you face the double-whammy of a de-rating.
Elementary, you’d think, but for some reason people like to buy expensive. Just ask my friends, who almost to a man 1 shunned my suggestions to invest for the long-term in the 2008/2009 bear market.
As investing veteran Howard Marks writes in Mastering the Market Cycle:
“Superior investors are people who have a better sense for what tickets are in the bowl, and thus for whether it’s worth participating in the lottery.
In other words, while superior investors — like everyone else — don’t know exactly what the future holds, they do have an above-average understanding of future tendencies.”
Nothing new under the sun

This is clearly just the chart above, jazzed up for a fund manager’s literature.
What’s interesting though is the date. This chart was created in 1998. Just two years later we saw the mother of all stock market bubbles, and nine years later one of its fastest and most frightening slumps.
If you’d seen this chart 12 years ago, wouldn’t you have been better placed to ride through that roller coaster?
Little ups and downs add up

I like this graphic because it includes lots of jagged lines. The other charts make riding investors’ emotions look as simple as going up and down on a see-saw, but in reality it’s a lot tougher than it looks.
Is any particular zig the start of a new leg-up – or is it the last gasp before a zag down into a slump?
Very hard to tell until five years later.
Funny old investors, and their emotions

(Click to enlarge)
I’m pretty sure I first saw this graph during the dotcom boom. It’s been regularly wheeled out ever since.
No wonder: Whoever knocked it up all those years ago knew everything you need to know about investors’ emotions, and had clearly been around the block.
I wouldn’t be surprised if he or she had said these things to themselves. Books and blogs are reasonable teachers, but nothing beats living through a cycle of fear and greed to really appreciate sentiment and emotion in the market. And to get a sense of your own risk tolerance, of course.
Further reading:
- How to spot a bear market bottom
- How to spot a bull market top
- The women were genuinely smarter, and kept dripping money in[↩]


Comments on this entry are closed.
1. Thanks for a great article. TA’s previous post segues into yours – nice continuity.
2. Those graphs are instructive. However, I think we need to distinguish between graphs of a given price vs time and those of mood vs time.
3. Regardless, each of those graphs only relates to some period of time – in isolation from the past. Yet it is surely useful to know the history: ‘how did we get here?’ Knowing this helps us to contextualise the present.
4. Turning to the present: I am reassured that the UK mass media doesn’t seem to be too interested in the recent strong performance of the FTSE 100 index. Hopefully we really are “somewhere between hope and relief”…
> but nothing beats living through a cycle of fear and greed
You have to lose your shirt at least once to have any chance of getting it right. That’s probably necessary to learn discipline, though not sufficient. Plus the bad habits tend to creep back over time. The dot-com bust is hopefully recent enough for me, with a quick refresher course with BP’s woes 🙂
Lovely set of graphics. I like the jagged chart best since just drawing a sinusoid with mood labels does not tell you much. Something that approximates to a real market is potentially more instructive. My favourite is the Rodrigue chart, which although much smoothed, includes similar bear and bull traps (i.e. “aversion” and “buy the dip”). These are the real problems areas for the investor.
The question now is, where are we now in the cycle? Everybody seems to be quite bullish about the markets in 2011. Would you agree?
Hi Sam. Well, as I say I think we’re just on the way between ‘hope’ and ‘relief’ on the emotional rollercoaster’s upswing stage.
Stock markets still look reasonably good value to me, given reasonable expectations of earnings growth. Not the screaming buy of early-2009.
Of course, anything can happen in 12 months in stocks or even over five years, so I don’t believe these things are inherently predictable. But I do think that’s the emotional backdrop.
Most non-enthusiasts still seem frankly terrified of stocks to me.
Reading the old comments from the original publication is quite interesting.
> Everybody seems to be quite bullish about the markets in 2011.
I just had a quick look on the Google graph for the S&P 500 and it looks to have increased ~135% (nominal) since the original article was published. Of course there have been some corrections etc but drawing a straight line with a ruler pointing 45 degrees up and to the right isn’t a million miles away from the truth.
I think that this is very scary for people my age (35). I literally started investing near the start of this almost constant bull run and so have never experienced the psychological effects like ‘panic’ and ‘capitulation’ (at least in an investing context :-)).
I agree with ermine’s comment from eight and a half years ago:
> > but nothing beats living through a cycle of fear and greed
> You have to lose your shirt at least once to have any chance of getting it right.
I worry that many people in my age cohort are yet to learn this!
Hi. I don’t believe people were bullish about the markets in 2011, as I said in my reply to your highlighted comment from Financial Samurai. 🙂
People were still incredibly pessimistic in 2010, which perhaps made some sense given the economic backdrop and uncertainties, but they disregarded the valuation angle at their peril. (Plus Internet technology was poised for a huge second act that seems inevitable in hindsight but was definitely not apparent back then…)
@Alex
> I am reassured that the UK mass media doesn’t seem to be too interested in the recent strong performance of the FTSE 100 index.
Which recent strong performance is that?
@Gizzard — Alex’s comment is from December 2010. As I’d hope would be clear from an attentive read of the article, it’s an update of an old classic post.
The comment by Alex was typically astute, and the contributions of this former regular of these parts remains much-missed. (I feel like an old schoolmaster. Why do the bright things eventually have to go and leave? 😉 )
@TI Sorry – my comment was a bit ambiguous. I should have linked it to Sam’s original.
It was clear to me that you hadn’t implied that in the original article.
@Gizzard The recent strong performance circa christmas 2010 I presume?
(it took a double take from me as well to spot the discontinuity at LdLs comment)
It’s tricky figuring out how best to redeploy these old articles.
In some ways I like keeping them as a treasure trove of time-stamped data.
For instance, in one of the sentiment articles I link to above — from c.2011/12 — I bemoan private investor obsession with mining companies and most especially gold and gold miners, and suggested it might come to a sticky end.
After several years of lower gold prices and initial push back from gold bug types (anyone remember this post from back then, and the debate in the comments? 🙂 ) and a torrid time for gold miners, the precious metals corner of the market looks quixotic and irrelevant to today’s eyes. It’s hard to believe just seven years ago it was pretty much all many small investors you met at events and similar were interested in! (And not coincidentally, I currently have around 5% in gold and gold miners, and have done for over a year. 🙂 )
So on the one hand it’s good to have the old posts in the archives for historical purposes.
But on the other hand, that’s quite a luxury. They are very rarely read now (even very closely when updated and re-published it seems 😉 ) and yet I feel some are real gems.
Particularly for the very old articles, I’d imagine only 1-2% of current readers have ever seen them, although that percentage will certainly rise among those who comment on the site.
Hence my updating and including the odd snippet from the original to try to build up a better picture over time — and perhaps even give ‘lived’ context — seems the way to go, albeit at the cost of the odd bit of confusion. 🙂
Cheers!
> When I wrote that I thought the markets were a clear buy in March 2009 for anyone who was ever going to buy shares, I got nasty comments across the blogosphere.
Not from me you didn’t, it was one of my favourite posts of yours. Because it gave me the boot up the ass to hit it hard 😉 Reader, I retired early partly as a result of that post.
@ermine — You did indeed prove a very creditable exception (though I don’t think I was reading your blog in early 2009, I can’t remember? 🙂 )
Thank you for resurrecting the article. It is still right on target and new readers definitely need to see this.
Part of the problem of investing is that the best option short term is to make money today/tomorrow – it means ploughing money into investments that you hope someone will pay you even more for tomorrow.
A good example is in tech stocks now and in 1999.
The series of boom and bust don’t help us that much.
Think of how we’ve had a huge boom in house prices over the last number of years and even more importantly, a huge rise in ordinary people buying BTL properties to make money on. There are reasons for doing it both real (tax advantageous, easy leverage) and pyschological (it’s my pension innit, you can’t go wrong with bricks and mortar) but BTL is not the same as actually investing money to build houses/buildings. House building hasn’t increased with the increase in prices (supply and demand what?) and just paying more and more money for the same old housing stock and hoping to people farm to collect their rents to pay your pension is what we have now.
Furthermore, if the government had as one of its main aims to keep the price of bread or milk or petrol affordable for most people there’d be riots but with housing it’s considered to be fine.
Hi hoping you can please help me understand your comment on the UK market.
The FTSE 100 index currently at 7,415 is close to all time highs. What is your perception of the UK market “trudging through the denial to capitulation stage for at least three years” based on therefore?
Based on my (very) limited knowledge, the index doesn’t suggest that a bear market in the UK has begun yet, particularly after regaining losses from second half of 2018 in 2019? or is your view that a bear market has begun and the index performance is been masked / propped up by sterling FX weakness benefiting UK foreign earnings, QE, low interest rates etc?
Is the index impact between capitulation and despair therefore where the material change happens?! Appreciate no one knows, but do you have a view as to whether you anticipate the next correction will likely be similar to the 2008 crash (shorter time period and steep) or more like the early 2000s (longer time period, just as steep).
My personal view given that many of the tools used back in 2008, cutting interest rates, QE have already been used up, and perhaps similar shocks to the system like the financial crash less likely (?!), that the next correction will be more like the early 2000s.
@EIWYGWYDGWYW — The FTSE 100 index first hit the 7,000 level nearly two decades ago. An advance of roughly 5% since then does not make me particularly impressed by its closeness now to all-time highs! 🙂
True, late 1999/early 2000 were clearly bubble conditions, but a many bear market has begun with the burst of a bubble and markets have subsequently multiplied many times over.
A more serious objection to my sneering at the FTSE 100’s puny advance is that there’s been a lot of dividends paid out between then and now, masking a far superior total return. This is true, but it always was thus with this index, too. Remember the FTSE 100 began life at around 1,000 in 1984 from memory. It went to 7,000 in about 16 years — a seven-fold appreciation. Since then — over 19 years — it’s done diddly. Notwithstanding everything I’ve written above (and stressing that there are no rules and can be no precision about this sort of thing) I’m minded to think people remain pretty leery of UK shares.
The one more serious caveat is it’s an index of value stuffed ‘old economy’ stocks on the whole, and the last 10 years has been a terrible time for them, compared to owning the growth stocks that have powered the US market higher. If, as has always happened before, we see a mean reversion then my musing above holds and the UK market is probably cheap and unloved.
On the other hand, if “it’s different this time” because software is eating the world — and slowly rendering many of the UK’s behemoths obsolete, or at least sidelining them from a growth perspective, then the UK market may not be cheap but justly valued.
I’m being very woolly with all this because I believe that’s the only state one can approach valuing and — whisper it — market timing. And of course this blog would stress that most people should make no attempt at trying it! 🙂
The best reason to know about the ups and downs of investor emotion — and the impact in the market — is not to try to anticipate and trade on it, but to avoid being scared out of investing when things inevitably, eventually, turn in another direction. And similarly not to hang back when markets turn up again and people seem too optimistic all of a sudden.
Hi Investor thank you for coming back to me so quickly and sorry for the ridiculously long name
I understand your point that comparing highs the ftse 100 hasn’t moved massively in decades but should the comparison not be from trough to peak which the Ftse 100 unlike the S&P 500 linear rise has experienced several?
I think the key takeaway for me is to try and switch my emotions off (not easy), don’t look at the current value and just pound average into the market with a globally diversified portfolio until a time when I need the money.
I love the charts. Your comment about “we won’t know for another 5 years” is so true.
Boring story:
About 5 years ago I worked on an oil platform which installed some very expensive down hole pumps to extract the last of the oil from a depleted and low pressure reservoir section. Part of my job was to monitor pump performance, optimise recovery and maximise the run life of the pumps – the north sea average was 2 years.
Staring at the trends very similar to the jagged line ones and adjusting the pump parameters occupied a large portion of my day. The info was fed real time back to a surveillance centre just outside Aberdeen.
The pumps were a nightmare from day 1. The gas fraction of the produced fluids was far higher than we’d modelled and the pumps were very erratic. Their production made up around 50% of the overall platform so when the pumps tripped, the platform had insufficient gas to run the turbines and invariably they’d trip, shedding load and often blacking us out – the pressure was on to keep the pumps running.
Inevitably we’d end up widening the setpoints at which the pumps would trip to avoid spurrious trips.
One evening, the pumps were playing up, several of the condition monitoring indicators spiked, the pump failed and wouldn’t restart. We pulled the pump with the drilling rig a few weeks later & returned it to Aberdeen for a tear down which I attended. The internals were shredded. With a replacement pump + the cost of lost production, I’d say it was a £20 million mistake.
I was called into the office in Aberdeen with the Production manager (my boss) and the pump manufacturer. Needless to say, the atmosphere was tense.
My boss pulled up the trend of all of the condition monitoring for the pump when it was in it’s death throws and said it was obvious what was going to happen, we were all incompetent and questioned why we were paying for real time monitoring (£25k/week) on these pumps when they couldn’t detect such an obvious path to failure.
I was annoyed and (unusually for me) stood up, took an A4 sheet of paper and held it up over the trend which he was using to berate us all with. I slowly moved the graph from the LHS to the RHS of the screen and asked him at which point, he would have expected the pump to be manually shut down. I explained that hindsight is 20/20 and any dick can look at a graph after the fact and predict an outcome – making future predictions in pressured situations without the benefit of seeing the future is more difficult.
@bob — What a story! Cheers for sharing. Platforms teetering on the edge of darkness in the North Sea beats the pressure to avoid mistiming the purchase of an emerging markets ETF any day. 😉
Dear Mr Monevator,
Just in case you do not get enough of this type of email …
THANK YOU.
That is it really.
I have leapt from a ‘know nothing’ to a ‘know nothing + 1 small notch’ in only 3 years.
Thanks to
1) You passing out your knowledge so freely
2) Vanguard LifeStrategy
3) Regular deposits
I am now able to keep the wolves a little further from the door.
One more time. THANK YOU.
Wishing you every happiness for your future because you have helped to feather mine.
Cheers
Pete “1 small notch” Doyle
@Pete — Thanks for letting us know, we can never get enough of hearing that sort of thing! 🙂 Good luck with your future notches!