
A conventional gilt is a reliable fellow. He is quite predictable right through to maturity, with yields drifting up or down broadly in line with his siblings.
But his wayward cousin the linker has no intention of going quietly. With less than a year to live, index-linked gilts seem to throw off the shackles of convention and lose all inhibition. Yields surge and plunge quite alarmingly.
What is the cause of such unseemly behaviour? And can investors benefit from it?
Linkers gone wild
Here’s the yield for the 22/03/2026 index-linked gilt for the year to maturity (blue), compared with that of the 2027 and 2028 linkers:

(All yield data is from Tradeweb .)
These three linkers start the year with similar real yields. But between June and July – about nine months from maturity – the 2026 yield suddenly jumps higher. The others barely move.
Linker yields reported on Tradeweb (and elsewhere) exclude the effect of inflation. They show the real yield – what your return would be if inflation was zero.
The actual return will be the real yield above plus RPI (to be replaced by CPIH in 2030). You only know this retrospectively, when all the relevant inflation reports are published by the ONS.
An opportunity?
You might be forgiven for thinking that this wild surge in yield represented an opportunity for a few months’ higher returns on some idle cash.
At least I hope you could be forgiven. Because that was the mistake I made.
But before we look at why there aren’t actually easy extra returns here, it’s worth illustrating this late-stage yield movement is not unusual.
The 2024 linker
The last index-linked gilt to mature before 2026 was the 22/03/2024 issue. It also had a 0.125% coupon.
Here’s the plot of its yield compared to its two nearest peers in the run up to maturity:

Again, the yields clearly diverge about nine months from maturity.
The 2022 linker
Just for fun, here’s the wild last ride of the linker maturing on 22/11/2022, mapped against its nearest peers:

This time there’s a slump in yield, rather than a spike. But more notable are the astonishing negative yields.
But let’s leave the madness of a post-pandemic inflation spike and a bonkers mini-budget and return to that late surge in yield on the 2026 linker.
Inflation
Inflation clearly has a central part to play in index-linked gilt pricing.
Look at annual RPI change below. Nothing seems to jump out that would account for the sudden change in yield on the 2026 linker:
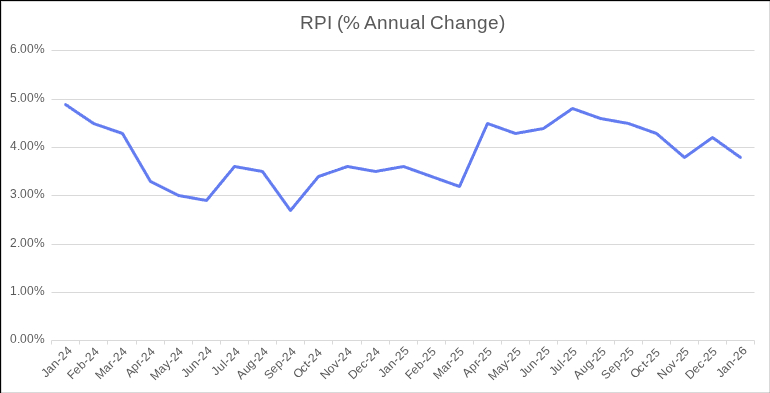
But the value of index linked gilts does not increase with annual inflation. It increases (and sometimes decreases) with the much more volatile monthly changes in the index:

Advance warning
Because (most) linkers use a three-month RPI lag — and inflation data is published with a few weeks delay — investors know part of the future indexation in advance (as laid out in the DMO rules).
For example, the RPI figure for January 2026 was published on 18 February. That value feeds into the index ratio applied to linkers during March. So on 18 February, investors already know the inflation uplift that will be applied to the bond over the next six weeks.
When a linker has a few years to run, this advance warning doesn’t tell you much about the likely overall return. But as you run down the final months towards maturity, it most certainly does.
Impact on yield
As a linker approaches maturity, a growing proportion of the remaining inflation uplift is already determined by published RPI data that has yet to be fed into the index ratio applied to linkers.
Once that future uplift is known, the bond’s price adjusts to reflect it, which shows up as a move in the quoted real yield.
When only a few months remain before maturity, even small changes in the expected total return can translate into large swings when expressed as an annualised yield.
The 2026 linker yield
We can see a steep increase in RPI in April 2025, for which the corresponding increases in the principal and interest rates of the 2026 linker would play out over the course of June.
Thus, as June progresses, with more of that April gain locked in and the prospect of a lower future inflation uplift, the market works to increase the real yield to compensate for it.
Which explains the surge that we saw earlier in the yield graph for the 2026 linker.
Coincidentally, there is also a big rise in RPI in April 2023 which would similarly account for the June rise in yield for the 2024 linker.
Adding it all up
I’ve shown below a comparison of the annual inclusive yield of the 2026 linker and the corresponding yield on offer at the time from the conventional gilt maturing on 31/01/2026.
The ‘inclusive yield’ here means the total return including inflation indexing — the real yield plus the RPI uplift.
Obviously, at the time you didn’t know what the inclusive yield would be. But we do know this retrospectively, now we have all the inflation data:

Despite the headline yield for the 2026 linker swinging up three or four percentage points, the inclusive yield doesn’t change by much more than one point, and then much more gradually.
The swings in headline yield experienced since June are just smoothing out the monthly fluctuations in RPI to give an expected inclusive yield that isn’t a million miles from what you could get from a conventional gilt with a similar maturity date.
Which is pretty much what you’d expect from an efficient market.
These seemingly violent moves in real yield are really just the market doing its job – adjusting for inflation data already known to investors.
Not so wild linkers?
Rather disappointingly then, and despite my rather racy title, the last year of a linker is not wild at all. It looks a lot like the last year of a conventional gilt.
In other words, a bit like holding cash.
Indeed funds like Vanguard U.K. Inflation-Linked Gilt Index and iShares £ Index-Linked Gilts ETF (both based on the Bloomberg U.K. Government Inflation-Linked Float Adjusted Bond Index) sell gilts in their final year. There isn’t much inflation protection left in them by this stage.
The hangover
Experienced linker investors will know all this already. I suspect some are now rolling their eyes – assuming of course that they got this far.
But I only started dabbling in linkers last year. And I jumped into the middle of the yield spike to see what would happen. Having some money invested is the only way I seem to be able to focus my attention enough to learn about different instruments.
My future – wiser – self now knows:
- Not to confuse a temporary spike in headline linker yield with the genuine prospect of a better return.
- To consider the baked-in effect of the last couple of RPI values when judging the value of a linker nearing maturity.
- There’s nothing exciting about linkers in their last year and very little to be gained by buying, or for that matter selling, in this period.
So I didn’t get rich, but I did learn something – which is the best kind of return you could wish for. (Just as The Investor told me when he agreed to let me write for Monevator…)


")


Thanks for the interesting analysis and explanation. Two or so years ago gilts seemed opaque to me but from reading articles on Monevator (and elsewhere) the fog lifted and I now hold a mix of low coupon conventional and index-linked gilts in preference to high-interest cash savings. However, I don’t feel I know enough to actively trade them, nor am I a market-timer in general, so plan to “hug the tortoise” until maturity (unless I need the money of course).
Thanks for this. I’d noticed the swings but not thought very hard about why it was happening.
I’d add the following, which I think overlaps with what you’re saying but comes at it from a different angle:
The real yield of a linker is an accurate reflection of the return you can expect to earn (annualised) based upon its current price, remaining cashflows, and assuming you reinvest the outstanding coupon payments.
(Also need to bear in mind your point that small changes ripple out into large swings of the annualised rate when there’s only a few months left.)
Contrast the real yield properties of a linker with its equivalent conventional gilt. This gilt’s yield is an accurate reflection of *nominal* return. A conventional yield of 15% might sound awesome but if inflation is running at 14% annualised then it’s offering a 1% real yield.
That breakeven rate (nominal yield minus inflation) is where the opportunity lies.
If the market is efficient then equivalent linkers and conventional gilts should offer the same real yield e.g. 1%.
But if inflation is higher than expected, the conventional gilt I bought at 15% will deliver a real yield worse than 1%. Let’s say its real yield is actually 0.5% because nobody predicted the Strait of Hormuz was going to become bomb alley.
Luckily I split my money between the conventional gilt and its equivalent linker.
The linker will deliver a 1% real yield no matter what inflation does. Thank heavens I diversified across linkers and conventionals.
However, if inflation is lower than expected, the conventional gilt wins. Its 15% yield minus a 13.5% annualised inflation rate = 1.5% real yield. What a bargain! Conventionals for teh win. Wish I’d gone all in on conventional gilts now.
If I’m reading the charts correctly then it looks like the market expected the April 2025 inflation read (published June) to be high. The yield on the conventional gilt rose May to June in anticipation.
The market thought May’s read (published July) would be OK though, as the conventional gilt yield drifts down June to July.
May to June, the linkers real yield drifts slightly down, implying its price rose a little. Implying the market thought built-in inflation protection was worth paying a bit more for under the circumstances. Because April inflation (June pub date) was gonna be bad, and maybe it would be worse than thought.
June to July, the linker’s real yield rises which means its price dropped. In other words, the market demanded more return (real yield) to buy TR26. In large measure because inflation is dropping away and so the linker’s remaining inflation protection won’t matter that much.
Moreover, those conventional gilt yields are looking pretty tasty right now and perhaps inflation will be even lower than expected – which makes nominals look a good bet. So accounting for all of that, the market demands a higher real yield as June progresses to convince them to buy the linker.
Again, it turns out the market knows a thing or two because the May (pub July) inflation read falls off considerably.
Again, as you said, a small drop in the price of TR26 can translate into a big fluctuation in the annualised real yield rate. The buyer actually earns less than that headline rate in the remaining 9 months, but on an annualised basis that it was they earn if they buy in at that rate.
The November and January spikes in yield line up with the September and November declines in RPI. Those reduce the value of the remaining TR26 cashflows in March as there’s no inflation floor on linkers. Price falls to compensate for smaller payouts and so annualised yield shoots up.
As maturity date approaches then the real yield for conventional and index-linked gilts should look more like cash as the term premium attenuates i.e. you can’t expect much of a yield bonus for locking up your cash for a few months.
Almost all bond funds sell their bonds before maturity rate. It’s not because there’s not much inflation protection left in their linkers, it’s because they have a duration mandate to maintain and because they roll down the yield curve.
(New-fangled target maturity date ETFs do hold bonds to maturity but they’re few and far between.)
I’m sure I’m missing some pieces of the puzzle and it’s only your excellent charts and commentary that have enabled me to make sense of the same crazy spikes I saw on Tradeweb for TR26.
@TA Thanks for your thoughts. I find it strangely comforting to discuss the minutiae of linker behaviour while markets crash around me!
Maybe I’ve misunderstood you – and I am new to this – but I think the April RPI figure is published in May (not June) and is used to set the inflationary uplift in linkers over the course of June.
It looks to me as if the market changes in real yield are driven more by stuff we already know than any predictions of the future – more sliderule than crystal ball.
For example, a graph of daily change in real yield for the 2026 linker over June shows a gradual increase over the month (every day a drip of that big inflationary uplift from April is added (yay!) but the market demands a corresponding drip of extra real yield to compensate (boo!) and then a slight steepening of gradient mid-month when the May RPI figure is published confirming a very small RPI increase. (This graph didn’t quite make it into the article.)
Many short dated linker funds do seem to hang on to linkers to maturity. Accepted, the two funds I mention sell final year linkers because that’s what their chosen index dictates. But perhaps at least part of the reason the index excludes them is because such late stage linkers begin to exhibit different, more cash-like behaviour.
@Engineer,
Do you think you could still have been right but in a much smaller way?-
* The linker price is estimating RPI
* so it wobbles between slight overestimate and slight underestimate
* the linker will be a better buy when an underestimate
* the yield spike points are very likely underestimate points
So if you wanted a rolling ladder of shorter direct gilts & linkers,
you might come off very slightly better by picking up linkers at blatant
spike points, gilts at blatant dips, and 50/50 when meh.
Compared to the mechanical buying of a giant bond fund.
I suspect we’re talking a tiny annual boost, but it might be a harmless optimization game for people who want the absolute best from their bonds? If the effect is there in the market. (did you think you might get, like 4% + what _you_ thought RPI was, when the linker spiked?!)
@Meany, I may have done ok in the end by chance but I don’t think you could say that ‘yield spike points are very likely underestimate points’ – if that were true then the market would iron it out until it wasn’t true!
What I thought I’d get when I invested was the 2% real yield when I invested plus RPI for the next 8 months – which I did get – it’s just that I hadn’t noticed that there was a big lump of inflation in April that I was now missing. I’m probably not going to be fiddling around with final year linkers in future!
Heh, yes, I’m sorry. this time I properly checked 🙂 The inflation figures are published mid month e.g. the current RPI figure is for Jan. It’s published 18th Feb i.e. one month lag just as you say.
(I’m so behind the times, I’m used to thinking of it as a 2-month lag as here we are in March but still only have the reading for Jan 🙂
OK, so that means that high April 2025 inflation read is out mid May 2025 and it affects the linker’s uplift from 1 July. May RPI informs indexation from 1 August.
Looking at your monthly real chart – The yield goes down (price goes up) end of April to end of May. So that high inflation read is out mid May and at that point buyers will accept less real yield. i.e. the linker is in greater demand – presumably because inflation looks like it’s worsening based on April’s read. (What do you see in the daily yields across May?)
Then the yield goes up (price down) from end of May to end of June. In mid-June the RPI reading for May is released and it’s benign. Buyers now demand more real yield from the linker (i.e. demand drops) because inflation looks OK after all. The linker has become less valuable to the market because inflation is cooling off.
You mention that the daily change in real yield for TR26 shows a gradual increase over the month of June.
“then a slight steepening of gradient mid-month when the May RPI figure is published confirming a very small RPI increase”
I think what we’re seeing is the market anticipating that inflation will fall – hence the linker is less valuable relative to conventional gilt. Then the yield gradient increases once the mid May RPI score confirms that expectation. Or perhaps the mid-May reading was even lower than expected. Either way, the price falls for that linker, sending the yield up. (In other words, sellers must drop their prices to get rid because buyers are less keen. The real yield goes up to enable the linker to clear.)
I’d just add, there’s no way the market doesn’t have a view. Prices move based on expectations and also news that changes those expectations e.g. hard inflation data.
We also need to think of linkers vs conventional gilts. You don’t want to hold the linker if its conventional counterpart offers a higher yield.
The conventional gilt yield contains an inflation premium. But it’s based on market expectations about the future course of inflation and not on an index-linked mechanism.
– Hence a conventional gilt wins if inflation lower than expectations.
– A conventional gilt loses if inflation is higher than expectations.
Demand for the linker will rise if inflation fears rise (because it’s a better refuge for your money than its conventional counterpart) and fall as inflation fears subside, affecting the real yield.
When you say “many short dated linker funds do seem to hang on to linkers to maturity.”
That’s interesting. Are you looking at iShares Up to 10 Years Index Linked Gilt Index Fund? they still have 8% in TR26 with 2 days to go so must be holding to maturity on Sunday. I didn’t know it did that. That’s rare. Typically bond funds sell before maturity – but it’s not because of some property of linkers – it’s standard behaviour.
And another question. Why is there apparently some consistent periodicity to linkers? It’s roughly 1-2months. Is that real or an illusion? (Wild intraday change today with both gilts and linkers.) Who said they were boring?
Thanks for the interesting write up The Engineer. Gave my some food for thought.
@TA: Would you consider a post discussing the real world inflation protection observed in the past by holding individual linkers vs a short term fund like Royal London one in S&S portfolio? Similarly the actual returns observed by individual gilts vs bond funds. Especially with most bond funds mandated to sell their holdings before maturity as you pointed out above. I don’t believe I’ve seen such a study in here or anywhere else.
I am still unsure if it’s worth the complexity of buying individual gilts and linkers for my bond allocation. It’d almost impossible to manage for Mrs WM in case of my demise! If the actual returns are close, I’d rather use an intermediate bond fund along with equal allocation to short-term global conventional & inflation-linked bond funds.
@WinterMute (#8):
Re: “I am still unsure …”
FWIW, I tend to agree.
Some of my reasons are given in this comment from last month: https://monevator.com/returns-arent-average/#comment-1937854, noting the footnote to point f) therein
Hey Winter Mute, this is a piece on individual linkers vs short-term linker funds:
https://monevator.com/index-linked-gilts-hedge-inflation/
Individual linkers are better at hedging inflation because you can guarantee holding until maturity. That doesn’t mean they have some intrinsic return advantage over time. They don’t.
If you hold the same portfolio of bonds as a bond fund, and hold them for the same length of time, then the only difference will be costs.
A bond fund’s habit of selling before maturity may improve return or subtract from return relative to holding until maturity. It depends on the future path of interest rates which is unknowable ex ante.
From my perspective, a linker fund is at a disadvantage relative to individual linkers because selling before maturity does incur losses when interest rates are rising. Hence they’re pre-programmed do the wrong thing during an inflationary crisis, when you can expect rates to rise.
The return disadvantage should wash out over the longer term. The fund sells at a loss but reinvests earlier in higher yielding linkers than the individual who holds bonds to maturity. However, I’m holding linkers to act as an inflation hedge first and foremost so I’d rather own the thing that does that. If you’re thinking purely in terms of long-rum returns then it’s reasonable to stick to funds and avoid the complexity.
I don’t think the same dilemma holds for individual nominal gilts. They don’t have an inflation-hedging role. There’s no ex ante advantage to holding a portfolio of nominals over a nominal gilt fund. The exception is if you can take advantage of the individual gilts that have more unusual properties:
https://monevator.com/reduce-tax-on-savings-with-gilts/
https://monevator.com/the-mysterious-case-of-treasury-2061/
@WinterMute > I am still unsure if it’s worth the complexity of buying individual gilts and linkers for my bond allocation.
For me, it comes down to whether you are buying them inside a tax sheltered environment or not. No way do I want to be thinking about possible CGT if I hold gilts outside my ISA or SIPP.
Also, you get no extra diversification buy buying them through a fund/ETF. The exposure remains entirely with HM Government. Unlike equities where diversification is important.
I really find this article unnecessarily confusing. Perhaps you could clarify in the graphs and the article what you mean exactly by yield. Gross Redemption Yield or Yield To Maturity perhaps?
@Jam (#11):
There is no CGT on individual gilts. That’s why I hold them in non-sheltered accounts, and go for the lowest coupon versions to minimise interest.
As The Accumulator has commented elsewhere, it’s only an issue holding gilts inside tax shelters if they’re displacing something else that would be more efficiently held inside your ISA/SIPP.
(As the gilt coupons rise, the potential benefits of tax sheltering also rise, but I’d still prioritise equities due to their higher growth potential + dividends.)
@j_ffs – I do like that that low coupon gilt move (though I don’t have the financial firepower to need to worry about it myself).
I suppose in theory you’d want to keep linkers tax-sheltered because high inflation could jack up the interest payments.
In reality, much depends on personal circumstances. I was struck that the £30,000 worth of linkers held in Monevator’s model decumulation portfolio threw off £150 in interest payments over the last year.
That could easily have been dealt with by the Savings Allowance (or Starting Rate for Savings) from the perspective of the sim retiree holding the model portfolio: https://monevator.com/decumulation-strategy-year-3-withdrawal-from-the-no-cat-food-portfolio-members/
On balance, I agree, I’d be more likely to prioritise equities in an ISA and hope to make those more valuable in the future. (Probably not going to be a choice once the new rules restricting cash-like securities in a share ISA come in).
@Syrio – Tradeweb publish real yield figures which is Yield To Maturity (YTM) after inflation is stripped out. On that basis, the nominal gilt yield mentioned also looks like YTM. The waters get muddy I think once you add the index-linked element back in, so I’m not sure about the inclusive yield part. Bonds are a minefield 🙂
@Al Cam / TA – Thank you for the links; I’ll go through them now. I guess my question really is, with the inflation spikes we had over the last few years, did a short (5yrs?) linker ladder offer any better inflation protection than a short-dated inflation-linked bond fund? Appreciate that this may not be an easily answerable question with lots of variables like duration and YTM etc,
@Jam: All my investments are now in tax shelters; so taxes are not a concern. I’m considering funds purely for a low hassle factor. If a fund offers the similar level of inflation protection as holding a rolling linker ladder, the I’d rather choose the fund. Similarly if a short-term bond fund can offer similar return as holding a bunch of short-dated gilts, then again the fund would be preferred.
@Winter Mute – Yes, a like-for-like portfolio of individual linkers better protects against inflation than a short duration linker fund because you can hold to maturity. The fund doesn’t do that and so is penalised by capital losses as interest rates rise. The fund would win if interest rates fell but that’s highly unlikely when inflation is soaring.
If the fund did hold to maturity then the outcome would be identical (assuming like-for-like portfolios and not accounting for costs.)
You’ll be able to see this in the article though of course it’s not possible to replicate the fund’s portfolio.
If you hold a global linker fund then it’s even less likely to hedge UK inflation. None of this means the fund can’t generate a similar or better return over the long term. It’s just highly likely to be sub-par when inflation is raging, which is when you want it to deliver.
@WM(#15), @TA (#16)
No disagreement with @TA’s answer. And, it does raise a couple of interesting points, namely a) why are bonds not held to maturity and who does that and b) currency diversification. I recently came across the OECD World Debt Report for 2026 (widely available FoC on the web), and Chapter 3 of the full report IMO gives some interesting details about a) wrt what they call “price sensitive investors”. With regards to point b) I guess you pays your money. IIRC some folks have previously made the argument @M that individual US$ TIPS offer some advantage over UK linkers. But that just looks even more complicated to me.
Lastly, my attitude to laddered linkers is (in no small part) influenced by two, possibly idiosyncratic, factors: 1) my being in receipt of a DB pension that has inflation protection, albeit capped, and 2) that AFAICT our real terms overall consumption* has reduced over time.
*not all of which has incidentally always been within scope for inflation calculations
Hi Al Cam, I’m digging into the murky depths of my memory banks here but I think bond funds mostly don’t hold to maturity because they were originally designed for financial institutions (e.g. pension funds) that demanded target duration products e.g. to precisely duration-match their future liabilities such as paying out pension income.
AIUI, there is also a potential profit to be made using this technique if the path of future interest rates proves felicitous for the fund manager.
Now that retail investors have become significant bond holders, some ETF managers have launched nascent ranges of fixed maturity / target date bond ETFs that do hold to maturity. Unfortunately ETF shops only bothered with this after hearing the disturbance in The Force caused by millions of retail investors being burned by the 2022 interest rate hikes.
I don’t understand why US TIPs would help if the objective is to hedge UK inflation. Aside from the currency risk, UK inflation is typically higher than the US and far more relevant to UK-based investors.
@TA (#18):
Re: “I don’t understand why US TIPs would help if the objective is to hedge UK inflation. Aside from the currency risk, UK inflation is typically higher than the US and far more relevant to UK-based investors.”
IIRC, the argument goes (or at least went at that time) that the £ is weaker than the $, by more than the inflation delta. Sure there is some risk – but isn’t there always. And, if you happen to do some of your spending in US$, then that could/should be an added bonus too.
From a personal perspective, I am not sure that my objective really is to hedge official UK inflation (howsoever measured) – but rather to be there or thereabouts as indicated by our (ever evolving) circumstances. Putting aside any notion of calculating a personal rate of inflation (for reasons discussed before) I think the objective is more like trying to hedge your rate of change of overall [annual] spending*. After adjustment for [official] CPIH inflation, our averaged rate of overall spending change is negative, and has been since at least the age of 50 [on average]. Thus, for us (and as things stand today) CPIH minus 1% to 2% should be probably adequate!
Since it came into payment my DB pension (that seems to cover at least our regular/core spending) has met that criteria***.
As ever, just my take, and I thought it might be useful to lay it out in a bit more detail.
FWIW, and IMO, the OECD paper (esp. chapter 3) is worth a read – even though it is rather long and takes a global perspective. In particular, some of the details about “price sensitive investors” and “their propensity to hold bonds to maturity” (see e.g. Fig 3.1) was news to me. Apologies if this is all old hat to you.
*which is made up of various sub-classes of spend**, some of which do exceed official CPIH (like Groceries) and, of course, is always subject to any scope changes too; and, as I have come to realise, what and how you spend your money is often much more influential than “pure” inflation
**not all of which are always in scope for inflation calculations – e.g. mortgage payments and the like
***however, it did lose out versus CPIH over the deferral period, which encompassed most of the most recent inflation debacle; and will become less generous when RPI evolves into CPIH in 2030, which is about a year after our SPs (which as things stand are fairly generously indexed) should have come on stream
I agree that if spending is well below income then the pressure is off. Part of keeping income lower than expenditure over many years though is owning assets that can keep up with inflation.
Happily, you have the perfect inflation hedge in a DB pension that covers your core spending.
My pension is defined contribution and the State Pension won’t cover core outgoings so I gotta think about how to cover the rest. It’s a three-legged stool:
Equities – hopefully beat inflation over time. (But they don’t like high inflation at the time).
Individual index-linked gilts – inflation-adjusted spending cash that will match inflation. Especially handy if equities are on the retreat during an inflationary outbreak.
Commodities – The best asset for beating inflation when the price index goes wild. Commodities require careful handling though and I can’t guarantee they’ll work, hence index-linked gilts too.
Re: TIPS – If anyone is betting that the £ weakens against the dollar by more than the inflation delta then I bet that’s a bet they can afford to lose.
Modern portfolios already have ample foreign currency diversification (and especially dollar exposure) via global equity holdings, or gold, or commodities etc. Makes no sense to take that bet *again* in the sliver of your asset allocation designed to cope with UK inflation. Especially when there’s an asset designed to do just that i.e. index-linked gilts.
Appreciate this isn’t your argument and you’re just putting it out there 🙂
Obvs it’s a different matter if you have US spending commitments. Then you’d hold TIPs for the same reason a UK-only consumer would choose linkers.
One of the things I like about the Monevator comment thread is hearing about people’s differing circumstances and outlooks. Has such a large bearing on investment approach.
@TA:
Appreciate the speedy reply.
Re: “so I gotta think about how to cover the rest”
May be worth quantifying to your own satisfaction what “cover” and “the rest” means for you & yours. I assume the rest is probably anticipated spend in excess of SP’s, once they come on stream (assuming that they do), and anticipated spend until then – but that is really just a guess on my part.
For the reasons given above, I happen to think CPIH +/- (to suit) X as a total target might have a lot going for it, assuming you can quantify X (and its sign). Hence, the Q that arises in my mind is what do you expect from each of your three legs (as I expect they are all different), and how they might morph as the SP’s come on stream. Leading, quite quickly I would guess, to a somewhat wonky stool!
In my case my DB is not perfect – as it has capped indexation. But it is pretty good and I am lucky to have it.
You’re spot on. I need to ensure I can cover needs and a few wants until State Pension arrives. When the State Pension arrives, I theoretically just need to cover spending above the SP. I don’t buy the idea that I’ll somehow be denied a pension – unless I cark it before then of course 🙂 All the same, there’s plenty of contingency because who knows what will happen.
I’ve run the numbers on the stool but it’s best not to take them too seriously. Or rather allow plenty of wiggle room should the future not be quite as bright as hoped.
Index-linked gilts provide several years worth of spending cash should equities be poleaxed by a long bear.
Equities themselves are the mainstay – circa 60% of portfolio.
Commodities currently about 5% of portfolio. Plus there’s 5% gold which is like an overlapping plate of armour. Plan is to get up to 10% in commodities when buying opportunities arise.
I suppose the fourth leg of the anti-inflation stool is the house which could be sold or reverse mortgaged. But then that would make it a chair 🙂
It’s worth adding that the biggest threats to UK retirements have by a country mile been inflationary nightmares that clobbered equities and bonds at the same time. Cash helps a bit in those scenarios but not enough.
The threat isn’t perhaps taken as seriously as it could be because the US experience dominates the discourse, and the worst events took place in black and white. Or even sepia. I know you know 🙂 Just mentioning it here because I don’t think it can be said enough.
@TA:
Thanks for the additional details. I agree re SP.
BTW I had not seen your most recent post on Commodities until after my last comment. I am bound to ask, does 5%, or 10%, or even 15% really move any dial? Wonky stool or wonky chair – take your pick, but I guess more legs probably gives more options. In any case, probably better to have them atop a solid floor covered with a nice deep-pile woollen carpet, to stretch the analogy vey much towards breaking point.
Re “biggest threats to UK retirements”, not to forget totally unforeseen spending shocks. Hemingway’s how did you go broke story applies: “Two ways. Gradually, then suddenly.” Some folks [used to?] obsess about longevity, but that seems to currently be a bit out of fashion – just like inflation was until fairly recently!
There be dragons – and a variety of types too, possibly even including ones we have never heard of. Yikes! But, such is life – always has been and always will be.
Re: “does 5%, or 10%, or even 15% really move any dial?”
Depends what you’re trying to achieve. For example, you could think of it as: “How many years could I live off this asset in a crisis when equities are down and I don’t want to sell them?”
More generally, when I run backtests then I can see a material impact from an asset class around the 10% level. 5% typically doesn’t do much.
re: spending shocks – totally agree.