Everyone says our homes cost too much to buy. But few look deeply into UK historical house prices for context.
Yet if you were to go back through the ages with a time-traveling estate agent in a TARDIS (period features, surprisingly roomy, in the same family for 900 years) you’d find it’s been a long while since British homes were cheap.
Even when property looked more affordable – the 1970s, say, or briefly in the 1990s – there were other things going on.
High unemployment, punishing interest rates, recession, or a more restricted market for mortgages.
With that said, the housing market did start to undergo a step-change roughly three decades ago. In hindsight, the advent of buy-to-let mortgages and steadily falling interest rates kicked off a 30-year housing boom. The tax advantages enjoyed by landlords versus homeowners didn’t hurt, either.
This all eventually made property more expensive on historical measures, such as the ratio of house prices to earnings.
But wait!
Like everybody who talks about house prices, we’re already rushing to diagnose what (supposedly) ails the market.
For today, let’s just look at UK historical house prices through various lenses, to put current prices into context.
House price growth over the past ten years
The average new home in the UK costs £294,845, according to Halifax. That’s an all-time record.
What’s more prices have been rising at an 11% a year clip.
At a time when wider inflation is approaching double-figures, this rate of gain may not seem so shocking for once.
Then again, the persistence of any price growth is a bit surprising. We’re at the tail-end of a pandemic, after all. Most other assets have crashed this year. Not coincidentally, interest rates are rising. That directly leads to costlier mortgages.
So is property simply proving its worth as a store of value? Or is this ongoing strength an anomaly?
Well UK house prices have already been climbing for ten years. See this graph from the Financial Times:

Source: Financial Times
Note that the Financial Times is using Nationwide figures. Nationwide has house prices a little lower than the Halifax ones I quoted earlier.
Indeed it’s worth knowing that all the different house price data compilers use their own data sets. Each with its own quirks. Nationwide excludes buy-to-let purchases, for example.
According to Nationwide the average UK home now costs £270,452.
That compares to £164,955 in 2012 – a total price gain of 64% in a decade.
However that figure isn’t adjusted for inflation.
Most things are more expensive than in 2012, right?
Ten-year house price growth: after-inflation
We can use the Bank of England’s cute inflation calculator to convert the price rise cited by Nationwide into real terms. (That is, inflation-adjusted).
Inflation data for 2022 is not yet available. Let’s therefore use 2021 as our base year, given how hot inflation has been running for the past eight months.
- Nationwide says the average house cost £251,133 at the end of 2021
- At the same point in 2011, the average house cost £164,785
Using the Bank of England’s calculator, we can see that the 2011 house price equates to £196,776 in 2021 money. (That is, adjusting for CPI inflation.)
Play with Monevator’s compound interest calculator and you’ll see that it takes about 2.5% a year over ten years to turn £196,776 into £251,133.
Therefore house prices went up by about 2.5% a year ahead of inflation over the ten years to 2021.
This is mildly interesting for property nerds. But it gets more dramatic looking further back.
Consider that by the end of 1991 the average house cost £53,635. That’s £99,618 in 2021 money.
- In nominal terms, house price growth was about 5.3% a year over the 30 years from 1991 – or 368% overall.
- But in real terms – after-inflation – annual growth was only a little over 3%, or 152% in total.
Clearly 152% is a lot less vertigo-inducing than a 368% nominal terms price rise.
Although as we’ll see later on, it’s still a lot faster than wages have grown. Which is why we keep hearing about a housing crisis!
(It’s also a reminder of how property has protected you against inflation).
Real UK historical house prices: a longer-term view
Nationwide produces an alternative real price index. It saves all this mucking around doing estimates with calculators.
Here’s how Nationwide’s real average house price has risen since 1984:
 Source: Nationwide
Interestingly this graph suggests that – in real terms – house prices are yet to recapture their 2007 pre-financial crisis peaks.
Conversely, you can argue it’s a bit silly to adjust asset price inflation by changes in the price of a basket of goods and services. But that’s for another day.
Very long-term UK house price history
It’s fun to induce vertigo by looking at the Nationwide and Halifax price data via longer-term charts. Download the Nationwide series and you can do so yourself.
Alternatively, you can wait for someone else to do it for you – the media is forever knocking such graphs out.
For instance one-time Monevator contributor Tejvan Pettinger recently published this chart showing UK historical house prices spanning more than 50 years:

Source: Economics Help
Any graph that rises from (apparently) near-zero like that will grab your attention. But remember these property values are not adjusted for inflation.
And is even 50 years a long enough time over which to evaluate house prices?
The UK is a very old country. And we’ve been buying and selling property since well before The Beatles released Sgt Pepper’s Lonely Hearts Club Band.
The long, long-term: house price history before Hitler
Academics have made various stabs at estimating the returns from property over more than a century.
For example, in the paper The Rate of Return on Everything: 1870-2015, the authors calculate that the very long-run return on property across 16 countries was just over 7%, in real terms.
Interestingly that’s very similar to the long-term real return from equities.
However this 7% annual return isn’t comparable to the house price series we’ve been looking at. That’s because its property values also incorporate the return from rent, to come up with a total return. In contrast, the house price data series only track prices.
But a bit later on the same paper estimates UK capital gains on housing since 1895 at 5.4% in nominal terms, or 1.25% real.
Which would indeed suggest the past 30 years have been a bit frothy, historically-speaking.
Meanwhile a more recent paper, The Best Strategies for Inflationary Times, pins UK annualised real housing returns from 1926-2020 at 3%. And as best we can tell that’s capital gains only. (It’s based on ONS data, which uses Land Registry house prices.)
My interpretation of these studies – together with the data from Nationwide and Halifax – is that property prices in the UK have been going up for over a century, but that growth has accelerated in the past few generations.
This would correlate with the popular notion that an increasingly egalitarian Britain has steadily transformed from a nation of renters to homeowners. At least until the past decade or so, when sluggish wage growth hurt affordability.
It’s fascinating research, with a lot of nuance and discussion that I’ve glossed over in this quick summary. Dive into the papers for a more thorough perspective.
How much do house prices go up in a year?
Looking at long-term house price history charts can be deceptive. The steady line rising from the bottom-left of the graph to the top-right makes a house price boom look as smooth as ascending a ski-lift on a windless day.
However just as icy gusts will rock your cable car, so house prices actually move in fits and starts.
Study the historical house prices graph below, which charts annual changes over the past 30 years:

Source: Nationwide
At first glance you might wonder how today’s prices are any higher since 2002. The graph appears to move downwards as you go from left to right.
Remember though, this is plotting annual house price changes. Not the absolute level of house prices. Anything above 0% represents a year when prices rose.
Looking more carefully, we can see there was a huge boom at the turn of the century. House prices rose by at least 10% a year – and as much as 25% – between 2002 and 2005.
Growth continued at a slower pace until 2007, when the market cooled. You’re seeing here the impact of the global financial crisis.
Don’t believe anyone who says house prices never go down! The chart shows that by mid-2008 prices were falling 15% year-over-year.
However this crash was short-lived. The Bank of England cut interest rates, and mortgages became much more affordable.
The falls soon turned around. And by 2014 house prices had recovered much of their losses.
Another brick in the wall: small annual gains add up over time
It’s interesting to note how often prices barely budged in the years between 2012 to 2022. Especially compared to that 25%-a-year surge of two decades ago.
Yet despite this sometimes-sluggish market, we saw in the ten-year price FT graph at the start of this article that house prices overall rose around 60% between 2012 and 2022.
This underlines that property is best approached as a long-term asset. Especially given the high cost (and hassle) of buying and selling. Inconsistent annual gains add up mightily if you give them enough time.
Indeed most people feel they do better with their own property than their pension precisely because they get on the property ladder for the long-term. They ignore its short-term fluctuations, and instead they commit to holding on to their homes.
This is exactly what leads to your parents or grandparents sitting in houses they bought for what seems like peanuts compared to today’s prices.
Historical house prices compared to earnings
The absolute level of historical houses prices is endlessly fascinating for Britons. But what really matters from the perspective of a would-be buyer is how affordable they are.
If the average annual salary was £100,000, say, then an average house price approaching £300,000 would be cheap-as-chips.
Buying such a home with a 90% mortgage would cost you £1,365 a month, with a 3.5% repayment mortgage over 25 years.
Assuming £5,500 of take home pay after-tax, our £100K earner would have plenty of spare cash leftover each month for Netflix subscriptions and avocado on toast.
But of course most people earn nothing like £100,000 in 2022. The median average salary of full-time UK workers is £31,285.
Hence all the hand-wringing about home-owning being out of reach for young people.
The time-honoured way to show this is by plotting average house prices against earnings over time.
Again, back when I first fretted about a housing bubble – you probably weren’t born – you had to do this for yourself in Excel.
Nowadays the data providers do it for you in your web browser. (Seriously, you may not be able to afford your own home but just look at your Internet go!)
Here’s 30 years of the house-price-to-median-earnings ratio for the UK (pink) and also London (green):

Source: Nationwide
The merest glance at this graph shows you why people feel property values have become more expensive – particularly in London.
It’s because it has!
When I first started looking for flats in the mid-1990s, the price-to-earnings ratio in London was barely three. Whereas it now costs nearly ten-times the median income to buy an average home in London.
The wider UK ratio has escalated just as dramatically, albeit from a lower base. And unlike in London it’s still climbing.
Previously I’d end the story here. But in 2021 researchers from Schroders threw this intriguing graphical cat among the price-to-earnings pigeons:

Source: Schroders
The Schroder analysts dived into a millennia of data from the Bank of England to produce this 175-year chart of housing affordability in the UK.
And you can see that in the Victorian era, UK house prices were at least as expensive as today compared to average earnings.
Quoting Schroders’ Duncan Lamont:
It may only be of historic curiosity, but it is interesting that house prices were even more expensive in the latter half of the nineteenth century. They then went on a multi-decade downtrend relative to earnings. This only bottomed out after World War I.
There are three important drivers of this: more houses, smaller houses, and rising incomes.
When I next update this article (diary note for 2032) I might try plotting this graph against interest rates to see if that’s a factor too.
Although to be frank I don’t know if there was much of a mortgage market in the early 1900s…
Don’t bet against the house
Soaring house-price-to-earnings ratios in recent years underline how higher UK house prices have made property ever more expensive for British workers.
But even that’s not the end of the story. Not by a long shot.
Most people buy a property with a mortgage. And interest rates fell pretty steadily from the 1990s until, well, this year!
So buying a property became easier to finance as rates fell, even as the absolute price level rose and wages only inched ahead.
Of course you might argue that financing costs are a different issue, at least in theory, and I’d have some sympathy with you.
But the facts on the ground seem to be that cheap mortgages have (in practice) supported higher price-to-earnings ratios for property, even as house prices climbed ever higher – just as low interest rates supported higher (in theory) prices for shares.
Of course, that (theory) ended in a stock market crash when rates finally rose.
Will higher rates do the same for property prices?
As per the Schroders’ quote above, we could also talk about what you get for your money with an average home these days, compared to the past.
Flats and houses are certainly smaller than they used to be. But some people – especially homebuilders – would stress they’re better insulated and finished.
And just look at that kitchen!
It was ever thus. Your great-great-grandparents’ loo was in their back garden. And as we’ve seen above, UK house prices have steadily ticked higher regardless.
Driven most of all by an infuriating platitude: we all have to live somewhere.
Will UK property prices keep going up?
Despite costing higher multiples of earnings, property has continued to be bought and sold every year.
It’s a functioning market, and as such its hard to call property ‘expensive’. Isn’t it just the going rate?
Many of you will disagree – perhaps I do too – and there’s no doubt we’ll be speculating about where house prices will go in the next 12 months for the rest of our lives.
But where do you think UK house prices will be in the next 30 years?
My guess: up, up, and away!
Note: a version of this article was first published in 2011. It has been re-written after another ten years of historical house prices were added to the ledger. We’ve kept the comments below for posterity. Do check their dates for context.


Comments on this entry are closed.
While the increase in the FTSE 100 and UK house prices is similar in real terms since 1984, the impact of gearing through buying a house with a mortgage means that the return on equity from a house purchase would have been much much greater than the return on an investment in the stockmarket over the period.
Given the relative valuation of UK house prices versus the stockmarket today, perhaps the clever trade is to borrow as much money as you can to invest in the FTSE 100 over the next 25 years? Any takers?
@Edward — Agreed. Gearing is the main reason why property investment has been so good for the UK public, leaving aside the odd bout of negative e.quity blow ups.
I don’t really think there’s a safe/cheap way to gear up to buy the FTSE 100 unfortunately. Having explored the various options (spreadbetting, options, cheap loans etc) the only one that offers anything like an attractive risk/reward balance to me is running a mortgage while investing, as discussed elsewhere on this site.
Possibly buying an investment trust with a lot of debt on a discount is another option for limited gearing, but you have other risks there.
I’ll be looking more at the FTSE vs House Price conundrum in a later post, so watch this space! 😉
Don’t forget to consider increases in population, average lifetime (increasing demand) as well as land, material and labour cost over the long term (restricting supply) !
On the subject of historical house prices, the recently published book “Safe As Houses? A Historical Analysis of Property Prices” by Neil Monnery is well worth a read.
@Robert – Indeed, I mean to get hold of a copy of that, I think I linked to it once from my Weekend Reading roundup to that affect.
@K – Sure. Complicated picture though, as those factors haven’t restricted boom and bust before (e.g. early 90s) or elsewhere (e.g. the US). I am minded to think restricted supply is a bigger issue than I used to in the UK, though, and probably does support gradually increasing real prices to SOME extent.
This may be a daft question but is it possible to but an index tracker, or similar product, pegged to the average housing prices? REITs possibly?
I’m hoping to move abroad for the next few years so don’t want to buy a house (plus, with the current uncertainty, would rather not put all my eggs in one basket) but at the same time it would be useful to put some of my (limited!) net worth into property.
Regards,
Guy
@guy – residential REITs are on the horizon for this year, at least partly due to changes in stamp duty for multiple purchases.
@Guy – As Gadgetmind says, some companies are talking about residential REITs. London and Stamford, for instance. They are available in the US.
Some spreadbetters offer the ability to take a view on house prices, but I wouldn’t personally recommend it and have never done it.
One could possibly invest in a UK house builder or a specialist property company like Mountview Estates (which buys rent control ‘blighted’ property for eventual resale) to gain some sort of exposure but it would certainly not be a direct correlation to UK house prices or anything like it, and would introduce other risks, too. Even buying LLOY is at least partly a view on UK house prices, I’d suggest!
@gadgetmind – thanks, that sounds perfect; I’ll have to do some research over the weekend
Inflation geek alert: deflating nominal house prices by RPI is actually a very strange thing to do. What does it mean? When a VAT rise pushes up RPI, have “real” house prices fallen? Also worth noting that housing costs make up 24% of the RPI basket today already, so the Nationwide stats deflate the cost of housing by changes in the cost of housing… that is not telling you much 😉
Deflating by average earnings is far more sensible. I look forward to your next article 🙂
Also, interest rates are important: it is easy to say “houses were cheap in 1984” based on P/E or real prices and ignore the cost of credit, since interest rates were at 10%+ in 1984. I’d wager a new mortgage on an average-price house would cost a similar proportion of earnings in 1984 as today.
@Guy: One (some?) of the spread betting firms allow bets on the house price indices, IIRC. Buying shares in house builders like Persminnon also gives you direct exposure to residential house prices; many of those firms retain a significant amount of equity in the houses they build and sell through “shared equity” deals. As well as indirect exposure since their future revenues is linked to future sale prices, of course. Loads of risk here, of course.
@The Investor thanks, interesting ideas – i’m not sure if I’m ready to take a punt on Lloyd yet!
Would the number of paying members in a household contributing towards the cost of a mortgage/rent be a contributory factor as to why property prices and rents have increased significantly during the past 30 years?
I suspect that 30 years ago the ratio of paying household members to mortgage/rent was close to 1:1; whereas today it’s likely much closer to 2:1.
@SB
absolutely – has to be a factor
its a bit of brutal irony for the feminists that their success in the workplace has come at a substantial cost to the option of having a family
Yes, “dinkys” (Dual Income, No Kids, Yet) will always be able to out-bid those with similar earning abilities but where there are additional mouths to feed and feet to shoe.
I doubt we could have afforded our first house if my wife hadn’t been working back then. Shame I can’t get her out to work now, but she claims that she’s too busy!
Hopefully the market will stay steady throughout 2012. Yes it does depend a lot on family situation and other factors. It is true that someone on the same wage but without a family has a lot more room for manoeuvre.
@gadgetmind thanks for your light hearted last comment but it does show you just can’t have it all!
Here’s to a prosperous 2012!
@Lemondy — Hah, I’ve fallen victim to your intimate knowledge of the mechanics of inflation before. Anyway, point taken, but all inflation adjusting (and indeed ‘the basket’) has an element of the Looking Glass about it to me. (If a computer is five times more powerful and half the price of five years ago, it seems to me inflation is at least partly a matter of opinion! 😉 ).
Definitely agree household income (and as SB and others have said, the number of ‘households’ and the total income flows in and out of that household) is perhaps most relevant indicator, together with the cost of rent and general lending conditions. I will deflate formally by average income and/or household income if I get the chance; I’ll certainly compare growth in the two trend-wise.
If only I could eat and drink computers, maybe live in a computer and drive to work in one life would be terrific value
Thanks for publishing this: I have been on a mission for sometime to convince people around me that buying houses is fine but they are homes not investments. And that rushing to pay the mortgage off feels psychologically right but is not a financially sound decision. The historical data you present illustrates this beautifully!
The fundamental reason why house prices have not collapsed in the UK as they have in the US, Ireland and Spain must be that we have not built enough houses for the demand.
Compared to all those, we are a small island with quite a large population density, strong NIMBY controls on property development and little public housing. We also have a mentality of owning our own houses and rental contracts are mainly short term. So people have little alternative really to trying to buy.
When 2008 occurred I never though that house prices would collapse by much more than they have already. Prophets of doom may have done some simple sums and expected prices to fall much further but (a) people don’t move or even put their houses on the market unless they have to when prices drop, (b) no-one will put their house on the market when they are clearly in negative equity, yet (c) there remains some need for people to move with jobs etc because not everyone will become unemployed. Therefore the slump is not so much in prices but more in numbers of trades. Which is bad news for estate agents.
I remember the late ’80s when mortgages climbed to 15% because of the stupidity of trying to shadow the DM. But at the moment interest rates are pretty low and likely to stay that way for a long time as the UK is re-entering recession or at best flat-lining. So while the property market may not be very buoyant, I don’t expect prices to collapse much more – other perhaps than in areas which become particularly depressed.
Of course the cynic/sceptic in me has to point out that the legislation that control house building is passed by people who already have their big houses in nice areas thank you very much and by maintaining these controls they ensure the scarcity values on their own properties.
@John
I think you’re right – but bear in mind the effects of inflation on house prices that are stagnant or even decreasing slightly. RPI @ 5% means they will be well over 20% cheaper in as little as 4 years time
Thats what I think will happen – wages will catch up and we’ll set off again on a merry ride…
…and it will set off eventually as supply will never meet demand in the UK as you rightly point out; too little space, too much planning law and too many vested interests
@John – Forgot to reply and say I have come around to this way of thinking a bit, too. I was more in the ‘prophet of doom’ camp before. The situation wasn’t *that* different in the early 1990s, and we had a price crash then, too. Perhaps that’s what made me personally resistant to the ‘not enough supply’ argument. However events (including incredibly cheap debt for those that can get it) have proven that constrained supply does seem to have underpinned prices more so than, say, the US or Ireland, where massive over-supply clearly egged things over cliff.
Interestingly, constrained supply didn’t save the housebuilders from having to do massive fund-raisings to survive, or their businesses from radically shrinking. I thought they looked like attractive investments in late November, and still feel the same.
Anyway, the net result is real house prices (and prices to incomes) probably do warrant having trended higher. The question is to what extent?
“The situation wasn’t *that* different in the early 1990s, and we had a price crash then, too.”
Yes, we did, and it was nice. I used it as an opportunity to buy my “forever” house, got planning permission to slap another house on some attached land and flogged it, which effectively halved my purchase price over night. I then paid off the remaining mortgage in double-quick time.
I won’t tell you what it’s worth now as you’d only hate me even more!
Don’t fear the dips: dips are every much of an opportunity to prosper as are the peaks, perhaps more so as brains do well in troughs whereas any old balls will do well in peaks.
@Gadgetmind — Nice work, well done! (Grr! 😉 )
I don’t fear dips at all, I love them. What I fear is buying into a London market that is already back at or above its highs.
@ The Investor – no-one can ever can ever call the highs or lows of any markets, but the London property market does seem to be defying gravity.
Anyway, at least you got into UK Commercial Property (UKCM) at a decent price – BestInvest keep failing with both real-time and limit orders, and blame liquidity, but my other online accounts are happy to buy take orders.
You can’t talk about the US as one market. For example prices in Phoenix, Detroit, Florida may have fallen up to 40% but in NYC they seem to be doing just fine. The same constraints on supply exist as in London, and the same price pattern is emerging. I bought an apartment in 2010 and it’s apparantly work 10% more than I paid for it, at the very least.
@gadgetmind – I am not sure about commercial property. Put it this way – people have to live somewhere even if they haven’t got a job but businesses can fold much quicker than people move or die. There is many a high street around with a few or more boarded up shops but few with boarded up houses except in the poorest of areas. People who lose their jobs will – at least in the short-medium term – still live in the same house and have some support for this. Businesses can fold very quickly and people don’t live in shops or sheds. Or rents can be driven down if a landlord is at all sympathetic to harsh trading conditions.
@Matthew – yes London, NYC and other magnets will retain a substantial portion of their real estate ‘wealth’ although it may be (a) that if you had bought in 2008 you may not hav ebeen so lucky and (b) the US seems to be managing its employment rather better than the UK and NYC will be the first place to benefit from that. We are fortunate to live in an area where I think house prices have hardly dipped at all which all goes to show how variable things are in the UK, as you point out for the US.
Very interesting reading. I am looking at properties and trying to see how the asking price compares to the price that it was when last sold so I am finding this information of great use to me.
I am a hypnotherapist, but obviously that isn’t something that helps me in negotiation ! I am not a mathematician so the charts are terrific
I recently wondered about the real lifetime cost of UK property purchase – in relation to lifetime net earnings. This is important as annual wage wage growth has halved in each of past 3 decades – from the high of 17% pa in 70s, 9% pa in 80s, 5% pa in 90s and now 2.5% pa. So in 70s wages doubled every 4 years – compared to 30 years today.
The absence of inflation based debt deflation makes a massive difference.
I concluded that a 1970 purchase as a baseline of 100 say, cost 300 in 1990 and 500 today.
I assumed an 85% 25 year Repayment Mortgage at 8% pa interest (long term net average after stripping out MIRAS) – for a 40 year working life at national average wage. I stripped out Tax/NI for pur[pose of calculating the net lifetime wage – and was obliged to assume that beyond 2012 wage growth will continue at current 2.5% pa.
In conclusion – from a standing start today – to buy a 3 bed semi in SE at 300k – would cost a ballpark of 40% of lifetime net wage – with a pension to pay 2/3rds final salary equivalent at age 65 a further 40% of net wage – the balance being tax.
London is also a different beast to the rest of the UK. Many investors are looking to buy property in this city as it’s seen as a safe place to invest, which ensures property prices are kept buoyant. It’s a great place to invest – buy the best you can in your first choice area is the rule of thumb!
Hi,
I need to find out the value of my present property as it was at the end of March 1982; where would I go to get that info please?
D C
I did my own graph based on Lloyds data and it’s showing a different story i.e. the house prices are up and poised to go above the long-term trend-line.
http://i.imgur.com/xpSquDg.png
@Damain — This article is from 2012, there’s been a bit of a recovery since then. 🙂
Yes it is a two year old post but the gap has worsened the picture if anything. We have had all sorts of boosts to house prices which have not ended up with a boost to house building, as I would expect – house building takes time to start and is no incentive when land prices are going up for builders to build or develop on land that they own – why bother when the prices are increasing anyway? Permission should be time-limited – use it or lose it – which would concentrate their minds as the price of land substantially would drop if they let the permission to expire.
We need at about 230,000 houses a year just to replace broken houses (23 million units typically lasting 100 years), let alone population increase that will require at least another 50,000 houses a year just to stabilise the market. No fiddling with the demand side of the equation is going to do that. It really is stupid. I feel terrible for young people who don’t want to have to rent forever.
@The Investor
Don’t expect too much from a guy who also misspeled his own name… 🙂
Is there a follow on article from here or any recent recap of the situation? I’m probably going to end up buying in the next year but I’m very cautious as I currently live with my parents so I’m building a nest egg and secondly my other half cannot work so our expenses situation will dramatically change!
Any advice or resources for working out if a specific property is a good punt? To be clear this is for a home, not an investment but I want to avoid negative equity. I’m in Northern Ireland where the data available appears rubbish. I’m also quite surprised I haven’t found any decent resources in terms of logically picking out where you should consider buying. It’s like all these incredibly intelligent and logical people just decide for this topic, they’ll throw in the towel and follow their emotions.
About my only consideration for where we’re looking has been a 10mile cycling radius from work, and access to a few amenities. I feel like I should be making a ‘smarter’ decision than only based on the above inputs but I’m struggling to find valuable insights in this regard.
Your links to the Lloyds spreadsheet are, understandably, not valid. Do you have an up to date one? The archive stuff I have from the Wayback engine is old. Also, I find the Nationwide data more credible and easier to understand, perhaps due to layout. Do you have any views? I read that their data are roughly the same.
@Peter — I’ve now rewritten the entire article, so hopefully these broken link issues have gone away. 🙂
Splendid, thank you. This helps my research a great deal.
Interesting update @TI, the long term data on affordability especially so.
——
“When I next update this article (diary note for 2032) I might try plotting this graph against interest rates to see if that’s a factor too.
Although to be frank I don’t know if there was much of a mortgage market in the early 1900s…”
—-
I wonder what effect the rise of mutual building societies (UK) from the 18th century has had on all of this? And now they are similar to banks when the laws changed in the 1980’s and the way capital was raised changed?
Both of these developments changed the proportion of rented/owner occupied property.
JimJim
Thanks for the article. RE the Nationwide/Schroders P/E charts, what would be the effect of plotting median household income (rather than median individual salary) against average house prices?
Perhaps that would also have the effect of making today look less ‘expensive’ on a relative basis?
One other aspect to consider would be the rise in dual income households which in theory supports multiples doubling.
There’s one big thing missing from this analysis and the real return on housing and that is maintenance costs. I’ve lived in my house in London since 1988 and over this time I have at times had to spend considerable sums on maintenance and refurbishment, including last year’s new roof. I suspect that this shaves something off the real return.
I think about 20-25% of the uplift in house prices can be explained by looking at the 25 year mortgage cost as a % of 25 year prospective real earnings . For the last ~15 years the real mortgage rate has been negative, and about 3-4% lower than the proceeding decade. Basically, much less of the payments are “wasted” on interest. It would be great to see this in a chart, as house price to current earning is too simplistic.
B
Love the historical chart back to 1845 .. fascinating.
I owned a Grade II* listed house and had all of its mortgage deeds dating back to 1875.
From the early 1920’s to 1930 the house trebled (from £300 to £870) in 8 years. I take the point that we’d just come out of the great war, and I have no idea how tired the house looked (although still has a lot of original features to this day) but the house price rises and being the gossip of the British populus is not a new phenomenen by any stretch of the imagination. Like every other property crash, it will recover ….. eventually. Eventually could be 1 or 5 years and it is crystal ball time to fathom that out. Each time it’s different.
On a separate note I know a few people who rent and wait for the house price crash, but can’t time it, don’t know when to step in and also when the crash comes they’ve waited so long house prices have risen too much anyway. It’s a fools errand to try and time it.
I’m buying a house right now, and it *feels* like the worst time to do so *ever* in all of recorded human history.
However, in light of the 0.5% base rate rise I ran some numbers today on what will be left to pay in 5 years time, without overpayment. If rates are at 5% in 2027 it will cost me £X more per month (mortgaged over a reduced number of years). So then I worked out what salary increase I need over that 5 years to get that £X more per month after tax…
If I can manage 2.5% increased pay each year for 5 years I’ll be fine if rates go to 5%. Now it doesn’t sound so bad.
Time, and the exponential function, are really the most powerful forces in finance.
Does the house price index take into account the cost of maintenance, repairs and extensions. In my area most houses have been extended in the past 30 years at a cost.
In central London prices are still where they were in 2014.
Are you sure that house price is in 2021 money terms? I think it is in 2011 terms as you have removed the inflationary impact between 2011-21 to make it comparable to prices in 2011.
Ignore comment above, see what you’ve done now.
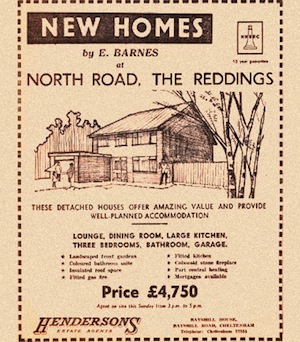
I currently live in a property more or less identical to the one in the picture at the top of this post. It was built in 1968 and was sold then for £5000. They currently sell for between £600 – 700k. To have to pay that sort of money for this type of house seems a bit tragic really.
In the Schroders graph what caused the corrections in the latter 20th century when the ratio breached 6?