Here’s some useful data on historical asset class returns for the US market.
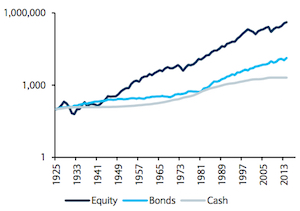
The graph to the right shows US total asset class returns with income reinvested since 1925, as calculated by Barclays for its Equity Gilt Study 2015.
As you can see, equities (stocks) have done much better than bonds or cash over the long-term.
Four important caveats:
- These nominal asset class returns include rises from inflation, which don’t actually make you any richer.
- The seemingly steady graph disguises a lot of ups-and-downs, such as the 2008/9 bear market!
- The US has been one of the very best performing countries in stock market terms over the past 115 years. Extrapolating that to other regions (or even into the future) could be misleading.
- A UK investor putting money to work in the US faces currency risk, which can increase or reduce your returns.
Let’s now look more closely at US historical asset class returns in real terms (that is adjusted for inflation).
US real asset class returns (% per annum)
| 2014 | 10 years | 20 years | 50 years | 89 years | |
| Equities (stocks) | 9.7 | 5.5 | 7.4 | 5.6 | 6.7 |
| Government bonds | 23.0 | 5.1 | 6.0 | 3.4 | 2.6 |
| TIPS | 18.3 | 4.0 | |||
| Corporate bonds | 14.9 | 4.8 | 5.9 | ||
| Cash | -0.7 | -0.7 | 0.3 | 0.9 | 0.5 |
Source: Barclays Equity Gilt Study 2015 (Note: Where no data is available, there is a gap).
The table shows real returns, which is the annualized percentage amount by which each asset grew (or shrunk) over the period, after inflation.
Remember that inflation eats away at your savings every year.
- You need a positive (greater than 0%) real return to keep up with inflation.
For example, if inflation is 3% then your money needs to grow by at least 3% nominal to keep up with its impact – after-tax – in order to preserve your spending power.
As the table shows, US equities have delivered returns far ahead of inflation.
American dream
As it happens US returns have also run ahead of most markets around the world.
You can see the impact of this hyper-growth for US shares in the following two pie charts from Credit Suisse.
They show how the US stock market has expanded over the past 115 years to make up a far larger share of the global total.

Source: Elroy Dimson, Paul Marsh and Mike Staunton, Credit Suisse Global Investment Returns Sourcebook 2015.
The sheer size of the US stock market means it makes up a very large percentage of any world equity tracker fund.
Combine that with its traditional strong returns and the vast breadth and depth of its markets and the US is an impossible country to ignore, whether you’re a passive or an active investor.
Using historical asset class returns
An understanding of historical returns is important because it helps us get over behavioural quirks such as recency bias.
Recency bias is the tendency we all have to think that things will continue in the same vein as they have recently, even when the long-term data says otherwise.
For instance, if you go out in a T-shirt and shorts in October in Scotland without checking the weather forecast – just because it was sunny yesterday and the day before – then you are suffering from recency bias.
(You’ll probably soon be suffering from flu, too!)
Hence it’s very misleading to consider just the last couple of years of asset class returns when deciding how to construct a long-term portfolio.
Only cash and very short-term government bonds provide a secure return over a short period.
All other asset classes are too volatile for that.
For example, consider the equivalent data for the US from 2010:
Returns to 2010: US real asset class returns (% per annum)
| 2009 | 10 years | 20 years | 50 years | 84 years | |
| Equities (stocks) | 28.7 | -2.2 | 5.8 | 5.5 | 6.6 |
| Government bonds | -15.5 | 5.0 | 5.3 | 2.9 | 2.3 |
| TIPS | 5.8 | 6.7 | |||
| Corporate bonds | 16.3 | 4.7 | 5.2 | ||
| Cash | -2.6 | 0.2 | 1.0 | 1.2 | 0.6 |
Source: Barclays Capital Equity Gilt Study 2010 (Note: Where no data available, there is a gap).
You can see the long-term return figures are little changed (for instance, equities had returned 6.6% a year over the 84 years to 2010, versus 6.7% a year over 89 years to 2014).
Shorter-term though, things are different.
Against popular expectations, 2009 was a stellar year for US stocks. Yet despite this they were still showing a negative return over 10 years of minus 2.2% in 2010, and they had been soundly beaten by less risky US government bonds.
That compares to the 5.5% positive annual return from US equities over ten years to 2014 shown in the first table, against a 5.1% annual return from US bonds.
This demonstrates how the longer-term traits of the different asset classes have reasserted themselves in the US, after that very poor ten-year period for equities.
The long and short of it
Stocks tend to outpace other asset classes over the medium to long-term precisely because they are far riskier over the short-term.
If the expected returns from equities weren’t higher than bonds, then nobody would choose to own them over less volatile and ultra-safe bonds – and the prices of stocks would accordingly fall until their expected returns rose.
That’s exactly what happened after bubbly periods for equities such as 1999 or 1929.
But while all this looks obvious in hindsight, timing the market to try to avoid booms and busts is notoriously difficult.
Nearly all the methods of stock market forecasting you’ll read about have proven very unreliable, and the best method isn’t much better than that.
This means that most people trying to save and invest for the future are best advised to follow a passive investing strategy, rebalancing their portfolios periodically to smooth out the booms and busts.
Over the long term – such as 40 years of investing towards retirement – the characteristics of different asset classes such as stocks, bonds, and cash should play out like they have in the past.
For that reason, if you’re using an investment return or compound interest calculator then it’s OK to use long-term historical returns as a proxy for the interest rate function required. Just bear in mind that the US stock market has been one of the best performing of all developed world nations.
UK historical asset class returns offer a more cautious reference point.


")
@Rob Bennett – I have deleted your comment and my patience has finally run out on allowing you to post your opinions about conspiracy in the markets on my blog.
Your comments are misleading and dangerous, and I don’t spend 3-4 hours writing articles to have you append your mantra at the end of every post.
There is no conspiracy about valuation in the stock market. This very article mentions valuation. Another reader Niklas pointed to an article just the other day in the massively influential Economist magazine about valuation: http://www.economist.com/business-finance/displaystory.cfm?story_id=15580336
Everyone knows about valuation. It is discussed non-stop.
In your deleted comment you asked why wasn’t Buffett giving warnings?
He was – he gave a speech at Herbert Allen’s Sun Valley retreat in front of Dotcom moguls at the height of the bubble in 2000. He told them the market was massively overvalued and that many of them would go bust.
Read the start of Alice Schroeder’s Buffett biography The Snowball for a long piece on the Buffett speech. It is a very famous incident.
Then read The Intelligent Investor by Benjamin Graham, which also discusses over and undervalued markets, and the dangers of the former, and thus why it is desirable to invest in the latter.
Graham, who was basically a Mozart/Shakespeare level genius — he spoke a dozen languages including Latin and Greek and made millions in stocks for fun – considered it prudent to keep 25% in stocks in even the most bullish market conditions because he knew how difficult market timing based on valuation or anything else was.
He wrote about valuation in 1935. Yes, this ‘conspiracy’ you see didn’t even exist in 1935.
Enough is enough.
Thanks for the run down.
We’re heavily invested in stocks now, but will slowly turn towards bonds as we get near retirement. As long a we stay diversified, we should be okay. Luckily, we are young enough that this crash actually helped us since we were able to double our shares in less than a year and rode the wave up.
I figure we’ll have to sit through a few more crashes in our lives, so we’ll have a heavy opportunity fund to keep us going through those as well.
Thanks again for the time you took to get those numbers together.
.-= Budgeting in the Fun Stuff on: Determining Our "Allowances" =-.
You really want to be American, yes mate?
Intersting historical study. I really enjoy a 4% risk free return on long term CD’s. It’s fine and good enough for me.
Everything else is play money!
.-= Financial Samurai on: The Mental To Physical Connection For A Healthier Lifestyle =-.
@Sam – LOL, I admire America and generally like Americans but no, I don’t plan on going for the green card.
The US and its market isn’t just another country, it’s so vast and influential that everyone around the world has to take it into account.
E.g. Well over half of CNBC’s daily broadcasting here in the UK is your US output — morning call etc! I presume not reciprocated. 😉
Besides all that, half my readers are American, and the basic principles apply in all capitalist democracies. 🙂
Thanks for this blog.The US and its market just not a another country, it’s so vast and influential that everyone around the world has to take it into account.
————————————————————————
Historical Stock
.-= Historical Stock on: Stock Breakouts And Resistance =-.
The 5 year time-warp was interesting – the economist article in your first reply says that all those old duffers are retiring which should pole-axe US valuations to the mid decade. We are that mid-decade, I guess QE made up for the demographic bust.
The higher they climb and all that.
I travel to the USA 6-8 times a year (once a month so far in 2015!) and have considered upping sticks and moving there a couple of times. I can’t see it happening now (getting older and no NHS out there!) but I’m happy to keep investing there as government meddling is less and the market is far more balanced than the FTSE.
@ermine — QE? Maybe. 🙂 People have been explaining away bull markets for hundreds of years. I have very little time for demographic arguments over anything but the very long term (30 years plus) when it comes to stock markets (*not* economies), and doubly so for the US.
If investors viewed the stock market as some sort of 30-year property or bond investment, I think most would be massively better off.
You’d put money in (or keep feeding it in), head off to work/fishing/etc for 30 years and when you came back you would probably have something reasonably close to that 5% real return.
Sadly, we have the market’s daily ups and downs thrust down our throats, which just makes investors buy and sell like electrocuted, hyperactive lemmings. Not good.
@UKVI > head off to work/fishing/etc for 30 years and when you came back
The trouble is there’s only so many 30 year periods a fellow has in a lifetime, and the first one is largely wasted in growing up unless you have a baby bond!
The pie charts are interesting apart from the US
If you look at the pie chart from 1889 markets not covered were just 2% of world stock market value
By end-2014 these markets totalled 19% of market value (Japan + China + Others)
Then again Russia and Austria just collapsed
Like they say in the small print “Past performance is no guide to the future”
“but don’t forget to adjust your portfolio as you age and your long -term shortens”
this is the area im having trouble with.
im 50 yrs old im currently 60/40 split between equities and cash
I feel ive only got 10 years . cash interest is so low and bonds might turn out to be worst, so I dar’nt invest there . Move out of equities into what?
When I asked myself “what instead of (or as well as) bonds?” a few years ago, I decided to go for infrastructure funds and property. These have done *very* well for me, so well that they are now looking as over-bought as bonds!
With inflation this low, even holding cash doesn’t lose much, but you could hold short term bonds, just make sure the fees are *very* low.
BTW, 10 years to what? Retirement I hope!
@ dawn ? 10 years. As a fellow reader with half-century on the clock isn’t that a bit pessimistic? Unless you are planning to buy an annuity at 60 you might have more than 35 years left.
I share some of your worry though – I am around 60% equities and plan to settle to around 50%. Any less and there isn’t much chance of keeping up with inflation. The rule I follow is “make sure you are ok to stay invested if there is a 40% fall in the stock market”. With a 60:40 ratio that 40% fall would be less than 25% of the portfolio so much less frightening.
@ gadget mind and passive investor
thanks for putting things back in perspective.
I plan on working till im 60, as im self employed and enjoy my work, I may continue, but if health or clients dwindle I want the option to live off investments. its not too bad because hopefully state pension will kick in at 67 and I will have a house to sell [ I doubt id rent it] so id have a big additional cash buffer too
sometimes I panic as I wished id started investing earlier so i keep thinking “only 10 years !” but I plan on keeping my equity investments forever and enjoy the good years and hold on through the downturns so yes im proberbly gonna be invested for 35 years but I don’t want to have too much money in the last decade of life because that’s when you need it the least! inflation is low at mo, im getting 2.1% on my cash isa so im not too worried about that for time being. and yes I have 15% in a commercial property fund which has been galloping ahead I may let that swell more and view at as bonds but I know its not and getting money out can be a problem. I read some where have no more than 75% in equities and no less than 25% so maybe 50% is about right [for later]
Holding commercial property via an open ended fund is always a bit of a risk as they do “shut the doors” at the first whiff of the thundering herd wanting out. We hold a few REITs chosen mainly for low gearing (or in the case of TRY, a fat discount when we bought!) but also a slug of the IUKP ETF.
@ Dawn, im 57 and have 90% in equities and 10% in cash. When I think of bonds i remember my parents bonds in the 1970s a few years of 24% inflation then turned the bonds to ashes.
@ jed, oh my god!
Yes, rampant inflation benefits those who’ve borrowed as their debt is inflated to nothing. This is what countries try to do with their sovereign debt by devaluing their currency as quickly as they can get away with, which is an option denied to those such as Greece.
As they say, your options with debt are to service it, default on it, or (if you print your own money) to inflate it away.
Dawn
There is some published evidence suggesting that you should not decrease your equity exposure leading up to retirement, it limits your upside potential but does not provide much benefit for increasing your minimum payout.
It suggests sticking with a fixed asset allocation.
http://www.iijournals.com/doi/full/10.3905/jpm.2014.40.4.052
However please not that this is firstly modelling on past results and it assumes adding in more savings each year and the model isa lso about gradually decreasing equity exposure. Non e of which may apply to you.
It is definately not modelling what to do when you have a portfolio that you are not adding to in retirement.
@jed – thing is stocks were also clobbered by inflation and huge price crashes in the 70s – I don’t think stocks outperformed UK or US government bonds in that decade. I think gold helped you beat inflation in the 70s, and a few % in gold stocks and a gold fund might be useful disaster insurance without seriously reducing long-term returns. Despite previous predictions of soaring rates and inflation, we’re verging on zero inflation or even deflation right now. Japan since 1990 has been a better model to observe than the 70s, though US and UK stocks have just about managed to undo the losses since 2000, with Japan still massively down since 1990. I prefer a balanced approach since we can’t know what is going to happen.
@david, Yes the stock market got clobbered in the 1970s but a stock investor came out of the 1970s in better shape than a bond investor. The problem with bonds is that when inflation reduces their value its gone forever. Assets (stocks , property etc) can recoup value lost through inflation. My parents purchased their bonds in the 1950s with a yield of around 4% their expectation was that this more than compensated them for any increase in inflation. Low inflation and deflation had been the norm high inflation only happened during wars. As a matter of fact prices in the late 1930s were lower than in the early 1020s. Nobody expected inflation to increase the way it did in the 1970s.
Wearing my active investor hat, this is always the sort of interesting dislocation I like to look for, and it’s a reason why I think it’s far more likely than not for example that long-dated German bonds yielding near-zero recently and so forth will end in tears.
The markets really do tend to move to confound the greatest number of people/money. Not because it’s some kind of intelligent and capricious being, but because of the mathematics of it.
Alas, believing that and even semi-consistently profiting from it are two different things! 🙂